
This work by New American History is licensed under a Attribution-NonCommercial-ShareAlike 4.0 (CC BY-NC-SA 4.0) International License. Permissions beyond the scope of this license may be available at newamericanhistory.org.
Connecting Present-Day Environmental Inequalities to Redlining Policies of the 1930s
What is the relationship between redlining and the environmental quality of a neighborhood?
Read for Understanding
While many have written about the socio-economic effects of redlining, more recently researchers are using Geographic Information Systems (GIS) analysis to uncover relationships between redlined areas and environmental conditions such as tree coverage, temperature, infrastructure, and topography. This type of analysis can help identify correlations between historically redlined areas and environmental inequalities. Read on to find out more about these connections.
Key Vocabulary
Assessor - a person who estimates the value of a property (for example, real estate)
Home Owners’ Loan Corporation (HOLC) - an agency created in 1933 by U.S. President Franklin D. Roosevelt’s New Deal that attempted to prevent foreclosures by refinancing home mortgages in default; created a color-coded grading system that assessed the credit-worthiness of city neighborhoods
Impervious surfaces - Surfaces such as sidewalks, roads, and parking lots that are covered by materials that water cannot easily penetrate
New Deal - President Franklin D. Roosevelt’s set of programs to help solve the economic problems triggered by the Great Depression
Redlining - the practice of denying a creditworthy applicant a loan for housing in a certain neighborhood even though the applicant may otherwise be eligible for the loan. The term refers to the presumed practice of mortgage lenders of drawing red lines around portions of a map to indicate areas or neighborhoods in which they do not want to make loans.
StoryMap - a web-based map integrating text, images, and multimedia elements to help users visualize data.
Stressor - something that causes stress or creates a burden
Suburbs - an area outside of a city that is primarily residential
Topography - the arrangement of physical features of a land’s surface
Tree canopy coverage - the proportion of an area shaded by trees
Urban heat island - occurs when parts of a city experience warmer temperatures than surrounding areas
Engage:
How do the words used by others contribute to our opinions about things we haven’t directly experienced?
What kind of power do words have? Your teacher will prompt you with a category and you will describe your favorite and least favorite example from that category. Category options: restaurants, television shows, musical artists, sports teams, colleges, or books.
Independently, list five words to describe your favorite in that category, and five words to describe your least favorite in that category.
When you have your two lists, add your words to a shared Google doc provided by your teacher - one list for the favorites and one list for the least favorites. Don’t worry if there are lots of duplicate words from other classmates. Your teacher will make each list into a word cloud using a generator like MonkeyLearn and share them with the class.
- What do you notice about each of the word clouds?
- How do you think the general public would feel about the thing/place you and your classmates described as your favorite after seeing the word cloud?
How do you think the general public would feel about your least favorite?
Next, examine this word cloud and in your notebooks, jot down your responses to these three prompts:
- I see…
- I think…
- I wonder…
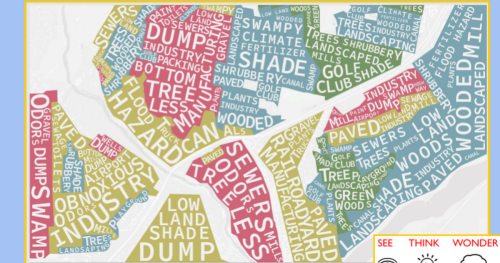
Lines that shape our cities word cloud slide
Maps courtesy of the UR Digital Scholarship Lab, ESRI, and The Science Museum of Virginia: “The Lines That Shape Our Cities” StoryMap http://ow.ly/dkGa50CRkPS
docs.google.com
Your teacher will direct you to share your responses either with an elbow partner, on big paper, or a collaborative document such as a Google Doc.
Once you have shared your initial observations, navigate to this StoryMap, entitled “The lines that shape our cities.” When you view the landing page, scroll down through the first few data visualizations. You will see the word cloud you just examined. What new perspectives does this version show?
The lines that shape our cities
Connecting present-day environmental inequalities to redlining policies of the 1930s
storymaps.arcgis.com
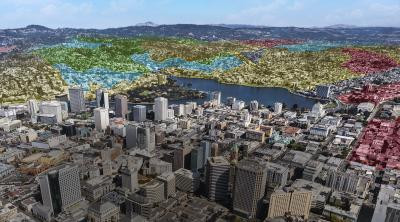
As you continue to scroll down the StoryMap, take a moment to examine the map and quote:
“Now imagine that these descriptions have had a lasting impact on home values, city services, education, crime, and the life expectancy of the people living there–decades after these words were chosen.”
Turn and talk with an elbow partner about your predictions of the long-term effects these descriptions might have on neighborhoods. Share your thoughts in a larger discussion with your class. If working virtually, your teacher may allow you to use videoconferencing or a collaborative document such as a Google Doc.
Your teacher may ask you to record your answers on an exit ticket.
Explore:
How might redlining policies of the 1930s have contributed to the persistence of inequitable environmental stressors today?
During the Great Depression, the federal government established the Home Owners’ Loan Corporation (HOLC) as part of the New Deal. HOLC assessors rated city neighborhoods on maps according to a grading system and banks used the maps to determine which neighborhoods would be safest for financial investment. “A” meant the “Best” investment and “D” meant the investment was “hazardous”. As you will read in the“A brief history” section of the StoryMap, despite the fact that “[r]acism, nativism, and class privilege are clear in the grades,” these maps were used for decades and “created or codified adverse conditions that still affect cities today.”
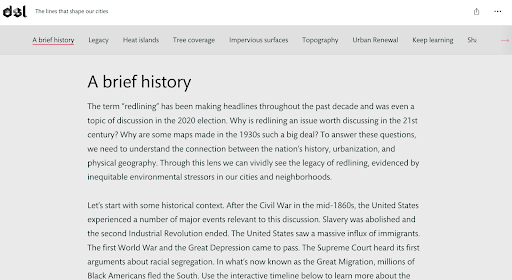
Read through the section entitled “A brief history.”
As you read, make a copy of and complete Part I of this reading guide.
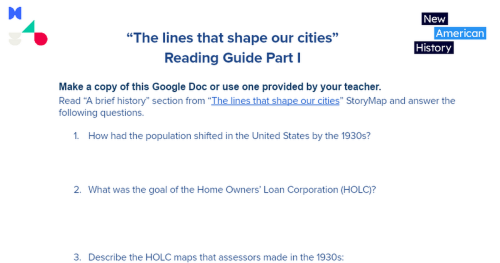
NAH The lines that shape our cities” Reading Guide Part I
Make a copy of this Google Doc or use one provided by your teacher. Read “A brief history” section from “The lines that shape our cities” StoryMap and answer the following questions.
docs.google.com
Your teacher may ask you to record your answers on an exit ticket.
Explain:
What is the connection between housing patterns in the past and the natural world that city-dwellers experience today?
Once you have read the “A brief history” section, scroll through “The lines that shape our cities” StoryMap to the “Legacy” section.
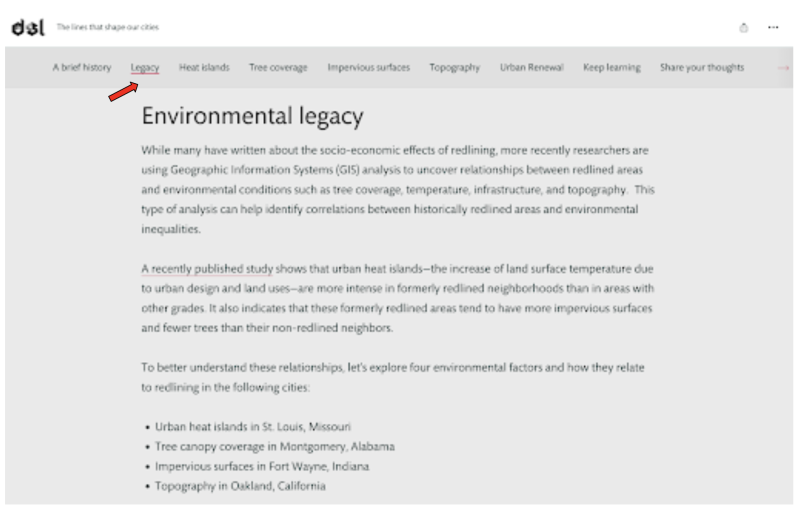
This portion of the StoryMap will introduce you to some urban inequalities related to the physical environment, using case studies from four U.S. cities:
- Urban heat islands in St. Louis, Missouri
- Tree canopy coverage in Montgomery, Alabama
- Impervious surfaces in Fort Wayne, Indiana
- Topography in Oakland, California
As you read, make a copy of and complete part two of this reading guide.
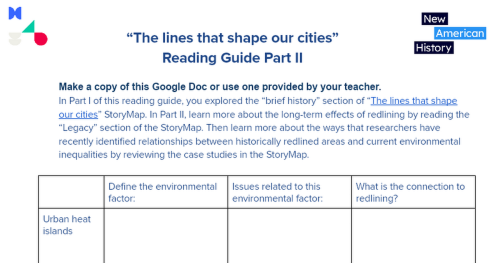
NAH Lines that shape our cities Reading Guide Part II
Make a copy of this Google Doc or use one provided by your teacher. In Part I of this reading guide, you explored the “brief history” section of “The lines that shape our cities” StoryMap. In Part II, learn more about the long-term effects of redlining by reading the “Legacy” section of the Story...
docs.google.com
Once everyone in your class has had a chance to explore the StoryMap, your teacher will provide a series of Chalk Talks for you and your classmates to respond to. You can either use big chart paper or Google slides, as directed by your teacher.
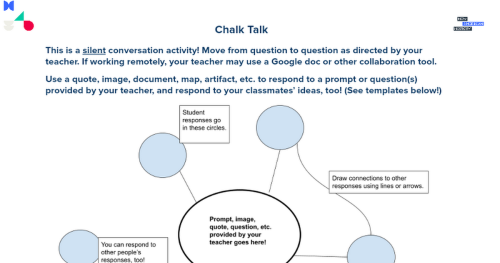
NAH Chalk Talk - Student Directions
This is a silent conversation activity! Move from question to question as directed by your teacher. If working remotely, your teacher may use a Google doc or other collaboration tool.
docs.google.com
- What is the connection between real estate policies in the past and the natural world that city-dwellers experience today? What is the importance of knowing about the relationships between historically redlined areas and current environmental inequalities?
- How can we address these environmental inequalities moving forward?
- Whose responsibility is it to address these environmental inequalities?
Your teacher may ask you to record your answers on an exit ticket.
Elaborate:
Why do we need green spaces?
To learn more about research on nature and human health, listen to this 12-minute Short Wave podcast from NPR entitled “Good Things Come in Trees.” When you are finished, you will complete a hexagonal thinking activity.

Good Things Come In Trees : Short Wave
Do you ever feel better after walking down a street that's lined with lush, green trees? You're not alone! For decades, researchers have been studying the effects of nature on human health and the verdict is clear: time spent among the trees seems to make us less prone to disease, more resistant to infection and happier overall. Aaron Scott talks with environmental psychologist Ming Kuo about why we need greenery and how you can bring more of it into your life.
www.npr.org
Once you have listened to the podcast, your teacher will instruct you to either work on your own or in groups to make a web of hexagons connecting ideas and key terms from the podcast and the StoryMap.
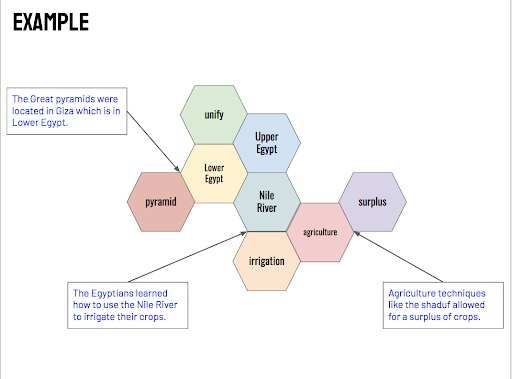
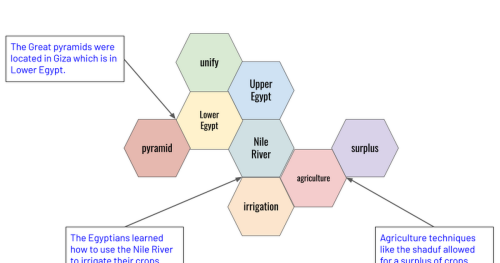
Hexagons have six sides and can connect on each of the sides to another hexagon. When each hexagon represents an idea, you can create your own Hexagonal Thinking web, based on the links you make between terms.
The example below shows how a student might connect hexagons to their thinking about Ancient Egyptians. Note how three of the connections are highlighted with an arrow and further explanation.
Sample Hexagonal Thinking web:
Your teacher will make a shareable copy of this Google slideshow and will let you know which slide you’ve been assigned to work on.
NAH Copy of Hexagonal Thinking
Google Slides template to use with small groups/breakout rooms created by @stacyyung Note: To easily change the slide headers from “Groups,” to “Breakout Rooms” (or vice versa!) go to slide master ( View -> Theme builder) and ctrl+f to find and replace “group” to “breakout room” Learn more about ...
docs.google.com
Directions:
- When you open your assigned slide, notice that there are twelve hexagons. Seven of them have terms already. Fill in the last five with additional terms you choose from the podcast or from the StoryMap.
- Drag and drop the hexagons onto the slide and connect them however you wish, but make sure you have an explanation for and evidence to support the connection. You may move the hexagons around as many times as you wish until you are settled on a web.
- Identify three (or more, depending on your teacher’s instructions) key connection points. Draw an arrow to the connection and add a text box to elaborate on why you connected those hexagons in that way.
Your teacher will lead the class in a debriefing about the webs you and your classmates made with a focus on why it is important for us all to have access to green spaces.
Your teacher may ask you to record your answers on an exit ticket.
Extend:
What opportunities might you seek out to positively improve environmental conditions in your community?
Using what you have learned in this lesson, reflect on the environmental health of your own city or town. Working on your own or in groups as your teacher directs, make a copy of and complete this local environmental assessment for your community.
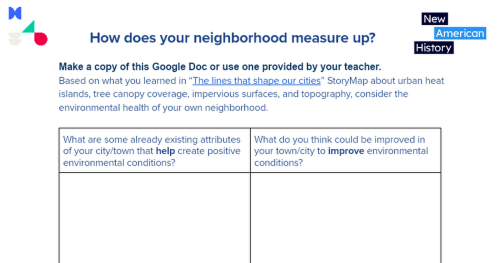
NAH Copy of "Your neighborhood" -The lines that shape our cities
Make a copy of this Google Doc or use one provided by your teacher. Based on what you learned in “The lines that shape our cities” StoryMap about urban heat islands, tree canopy coverage, impervious surfaces, and topography, consider the environmental health of your own neighborhood. What ar...
docs.google.com
Your teacher will lead the class in debriefing. Your teacher may offer a collaborative document such as a Google Doc or Google Slides to support the discussion, and for sharing ideas you may want to revisit them later.
We would love to hear your ideas for taking local action. Share your work if your teacher or a trusted adult permits. You may email us at editor@newamericanhistory.org or share via social media (links on our pages). Be sure to tag us as you share!
Finally, click on the “Share your thoughts” tab of “The lines that shape our cities” StoryMap and leave your thoughts about redlining using the red “ +Add Your Feeling” button above the map.
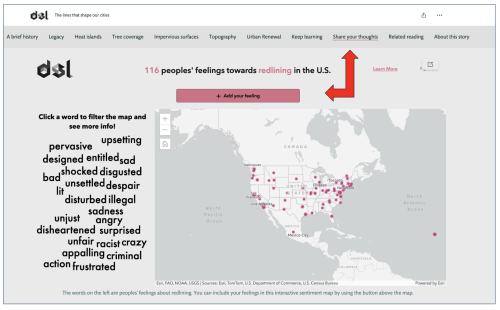
Share your thoughts...
The lines that shape our cities.
experience.arcgis.com

Your teacher may ask you to record your answers on an exit ticket.
Citations:
“Chalk Talk.” Project Zero. Harvard Graduate School of Education. Accessed November 8, 2022. http://www.pz.harvard.edu/resources/chalk-talk.
“The Lines That Shape Our Cities.” ArcGIS StoryMaps. Esri, March 8, 2022. https://storymaps.arcgis.com/stories/0f58d49c566b486482b3e64e9e5f7ac9.
Potash, Betsy. “Hexagonal Thinking: A Colorful Tool for Discussion.” Cult of Pedagogy. Cult of Pedagogy, September 11, 2020. https://www.cultofpedagogy.com/hexagonal-thinking/#.
Scott, Aaron, Margaret Cirino and Gabriel Spitzer. “Good Things Come in Trees.” Produced by NPR. Short Wave. June 21, 2022. Podcast, 12:15. https://www.npr.org/2022/06/15/1105229060/good-things-come-in-trees.
“See, Think, Wonder.” Project Zero. Harvard Graduate School of Education. 2019. https://pz.harvard.edu/resources/see-think-wonder.
“Using Hexagons to Build Critical Thinking Skills.” Edutopia. 2021. Video, 2:54. https://www.youtube.com/watch?v=c88LmOC86D8.
“Word Cloud Generator.” MonkeyLearn. MonkeyLearn Inc. Accessed October 25, 2022. https://monkeylearn.com/word-cloud/.