
This work by New American History is licensed under a Attribution-NonCommercial-ShareAlike 4.0 (CC BY-NC-SA 4.0) International License. Permissions beyond the scope of this license may be available at newamericanhistory.org.
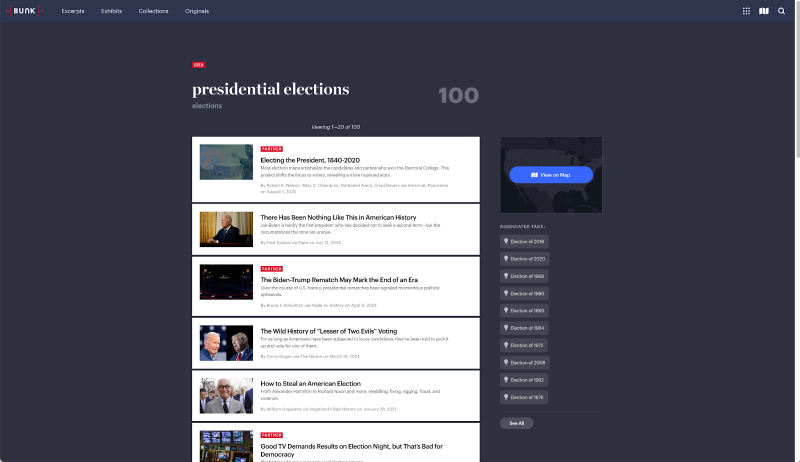
Electing the President
1840-2020

Read for Understanding
While we are used to seeing election maps in red and blue, a basic map doesn’t always tell the whole story. We will look at the Electoral College and use data visualizations of past voting patterns to understand how American presidential elections really work.
Key Vocabulary
Bipartisan - including members from two political parties or opposing groups
Bubble map - a map using circles of different sizes to represent a numeric value on a territory.
Cartogram - a map that combines statistical information with geographic location.
Convention – a meeting held by a political party to vote on its platform and candidates
Data visualization - the representation of information in the form of a chart, diagram, map, picture, or other format
Disenfranchise - to take away the right to vote, or remove a right or privilege
Electoral College - (in the US) a body of people representing the states of the US, who formally cast votes for the election of the president and vice president.
Electorate - all the people in a country or area who are entitled to vote in an election
Infographic - a visual image such as a chart or diagram used to represent information or data
National Public Vote -a system guaranteeing the Presidency to the candidate who receives the most popular votes in all 50 states and the District of Columbia
Partisan - including members or beliefs of only one political party or group
Platform – a formal and detailed list of views held by a political party
Polarization – the sharp division of people based on their differing views; an example of political polarization is extreme conservative and liberal views
Popular vote - the choice expressed through the votes cast by the electorate
POTUS - an acronym used to describe the President of the United States.
Ranked-choice voting - this electoral system allows voters to rank candidates by preference, meaning they can submit ballots that list not only their first-choice candidate for a position but also their second, third, and so on. Currently used in some localities in the United States, and other countries including Australia and New Zealand.
Redeemers - at the end of Reconstruction and the abandonment of federal efforts to advance racial equality and protect the rights of African Americans, southern Democrats—called "Redeemers"—retook power in the South
Redistricting - the state-by-state process of deciding how to divide up the population geographically, organizing community members into voting districts, determining who represents the people in your state, town, and community.
Representation - someone who acts or speaks for or in support of another person or group, as in a member of a legislative body, such as the House of Representatives of the U.S. Congress or a state government.
Tag - relevant keywords that are utilized to show connections throughout a webpage. Tagging content involves including keywords evenly throughout the text or site, including headings, as well as embedded in the content.
Third-party – an alternate political party that is separate from the two-party system (Republicans and Democrats)
Engage:
How can we use maps and data to explore voting patterns?
Examine this quote from historian Robert K. Nelson, the Director of the Digital Scholarship Lab at the University of Richmond, discussing the “Electing the President” project.
Most election maps emphasize the candidates and parties who won the Electoral College. This project shifts the focus to voters, revealing a more nuanced story. Other forms of data visualization are used to explore the history of presidential elections and the presidency.
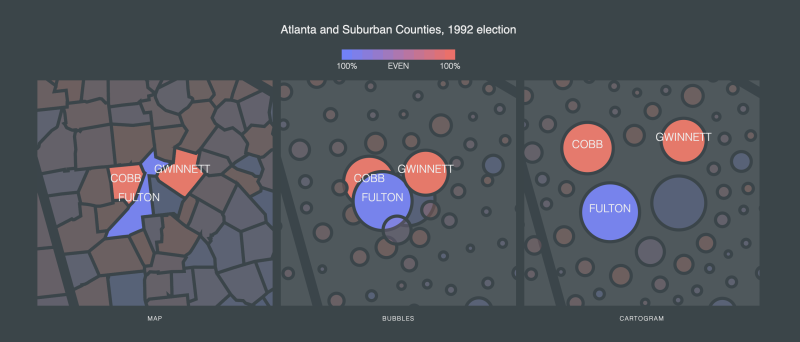
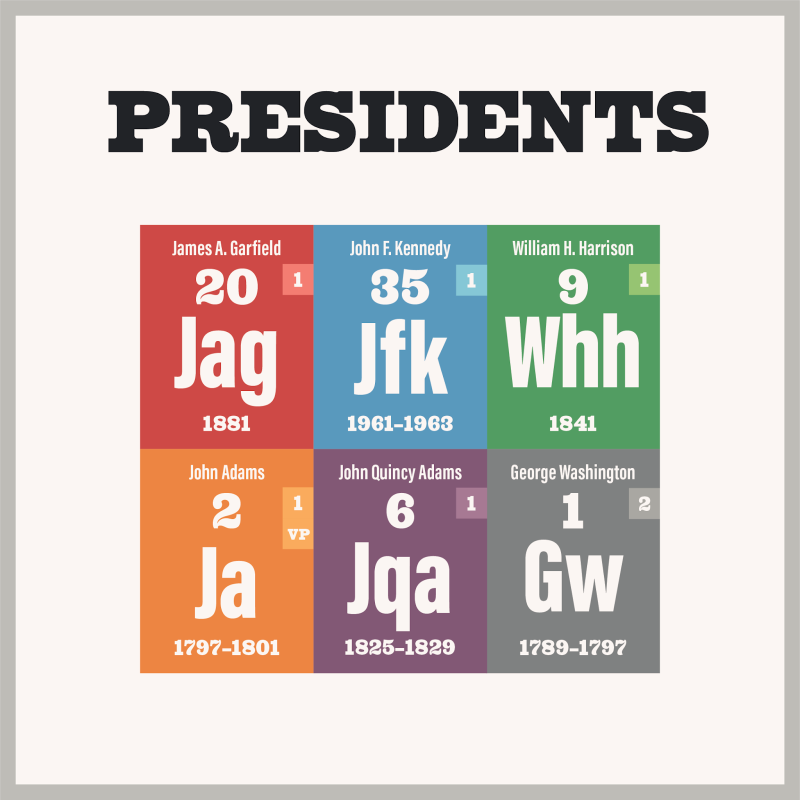
Next, examine this data visualization of three ways to express election data, from the Electing the President map.
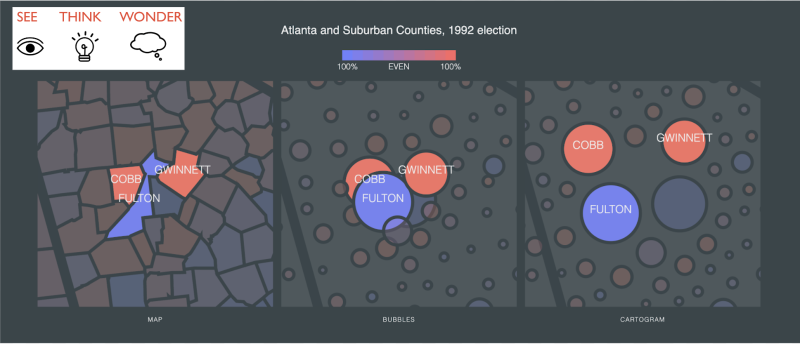
Use the See Think Wonder thinking routine to share your thoughts on the image. Your teacher may ask you to use this graphic organizer to record your thinking.
Turn and talk to an elbow partner, sharing your thoughts.
- Where might you see similar data visualizations used in another class or subject you are studying in school?
- How are shapes and colors used in the data visualization to add meaning or represent information?
- How might you find some answers to your questions?
Your teacher may ask you to record your answers on an exit ticket.
Explore:
How has the way we explore and analyze historical and political data changed over time?
Explore these earlier data visualizations of presidential election results, using maps from the Library of Congress map collection. Use the links provided to zoom in and notice the details included in each map. Working with a partner, as directed by your teacher, each one of you should respond to the questions below for one of the maps, and then compare your answers.
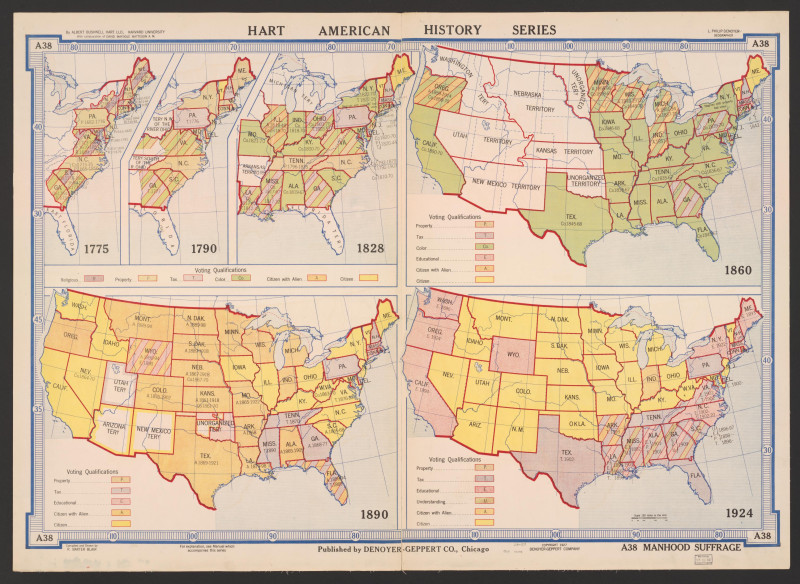
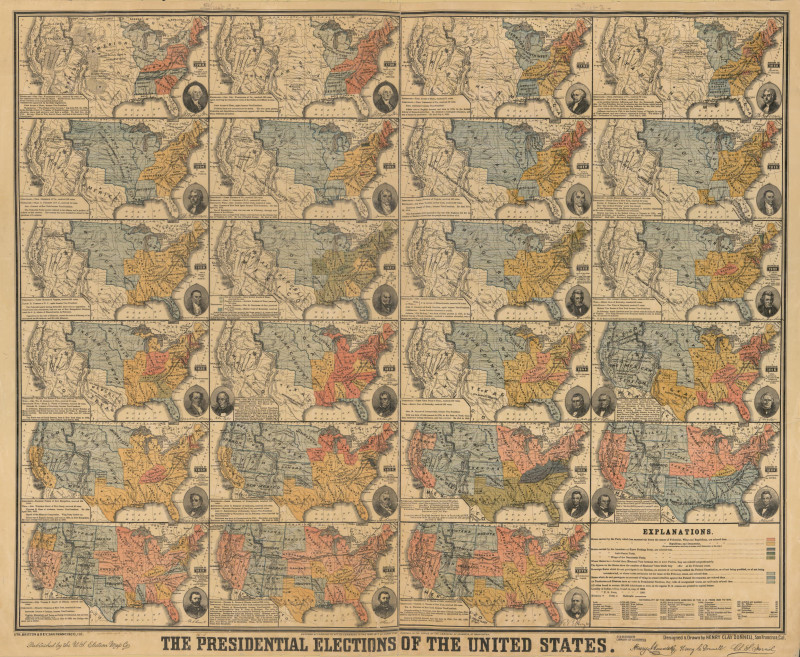
1/2
- Why was this map/chart made? What is the purpose of this chart?
- Who was the audience for this item?
- What information do you see on the chart?
- What is the larger story or context within which this chart was created?
- What information seems to be most important?
- What information seems to be least important or hidden?
- How else could this information be represented?
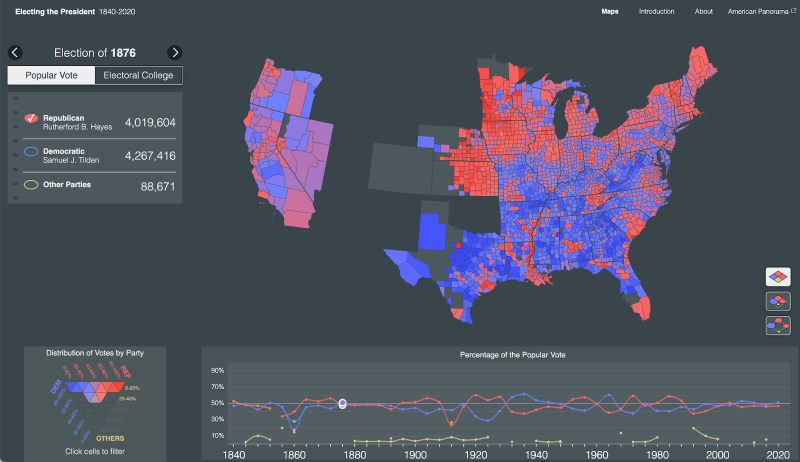
Next, take a few minutes to return to exploring the map from the University of Richmond’s Digital Scholarship Lab.
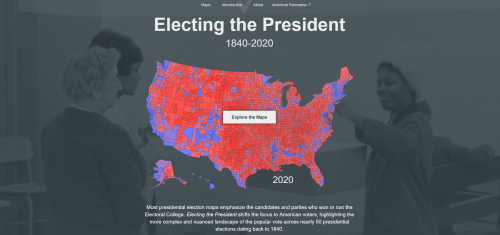
Electing the President
Interactive maps and visualizations of presidential elections from 1840 to 2020.
dsl.richmond.edu
Select “Explore the Maps.” Spend some time exploring several years worth of data. Select some of the same years you viewed on the historic maps from the Library of Congress to compare the way the data is visualized.
Turn and Talk to a partner to share:
- 3 things you already knew about this topic
- 2 new vocabulary words you learned
- 1 question you have about the map so far
Read the Introduction, written by Robert K. Nelson. You may recognize an image from the See Think Wonder activity you viewed earlier.
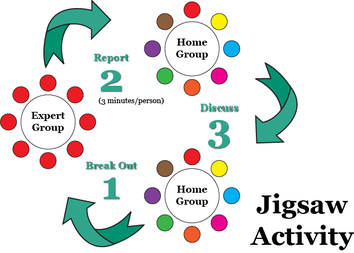
Your teacher may choose to Jigsaw this section and assign you and a small group to read and become “experts” on one section of the introduction, then join other groups with one “expert” for each section of the text, and share your knowledge with others.
A Google slide deck is provided to help organize your thoughts for the Jigsaw discussions.
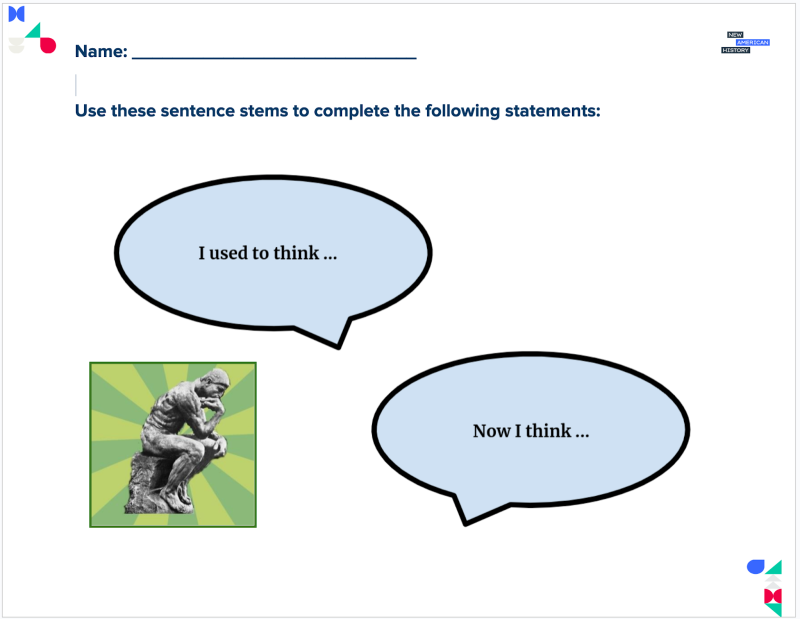
After you complete the Jigsaw group activity, your teacher will lead a brief discussion comparing the historic maps from the Library of Congress to the way data is visualized on the digital maps. Revisit the statement from historian Robert K. Nelson to see if your thinking has changed. Your teacher may provide a paper copy of this graphic organizer to record your thoughts, or you may make a digital copy and respond.
Your teacher may ask you to record your answers on an exit ticket.
Explain:
Does your vote count?
While this seems like a very simple question, the answer is anything but simple. Here is a quick refresher on how the Electoral College works, and why the popular vote does not always win in a U.S. Presidential election. View the video Electoral College Explained.
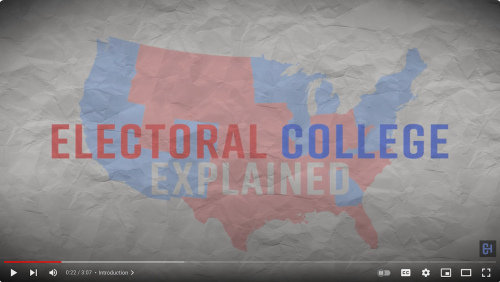
Electoral College Explained
Civics, minus the headache
www.youtube.com
Now that you are more familiar with how the Electoral College vs. the Popular Vote works, let’s return to the map and look a little closer at some of the ways this system has shaped our voting history as a nation.
Historian Ed Ayers gave remarks at a panel discussion hosted by Citizen Travelers to citizens across the country. Use this reading activity to explore his remarks and a few more related maps from Electing the President, as well as a previous version of the project called Voting America. Working with a partner, as directed by your teacher, read each scenario and analyze the corresponding map as linked in the reading.
When you complete the content reading activity, take a few minutes to return to the original question, “Does your vote count?”
Record your answers in a Reflective Journal entry.
Your teacher may ask you to record your answers on an exit ticket.
Elaborate:
Is it time to rethink the Electoral College?
Almost since it was adopted, the Electoral College has been a source of much debate and controversy. In recent years, some critics have called for an end to the Electoral College. Other ideas including Ranked Choice Voting and a National Public Vote have gained momentum with mixed reviews.
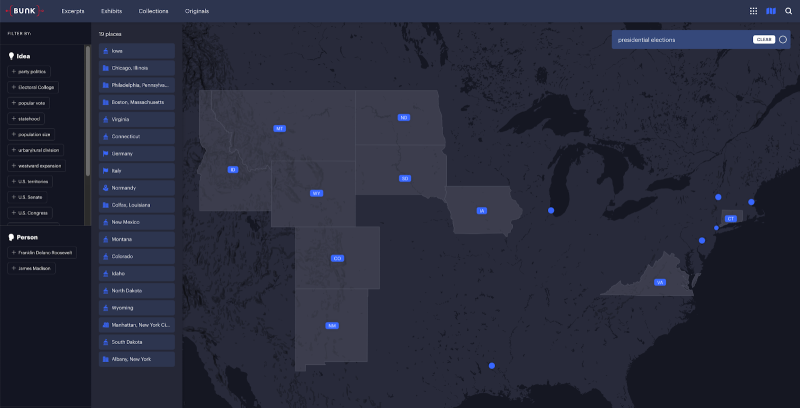
Explore the Electing the President map as connected in Bunk. If this is your first time using Bunk, check out the How Bunk Works section for help navigating the site.
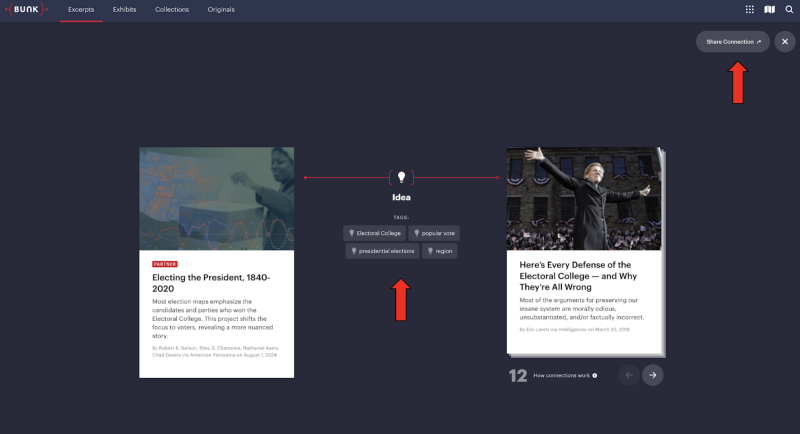
- What types of Connections do you see as you scroll through the deck of existing connections to the map?
- What Tags do you see that connect the excerpt from the Introduction section of the Electing the President map to other content?
- What results do you see if you search for a broader term, such as Presidential Elections? Are there new Tags or types of content included in the Connections?
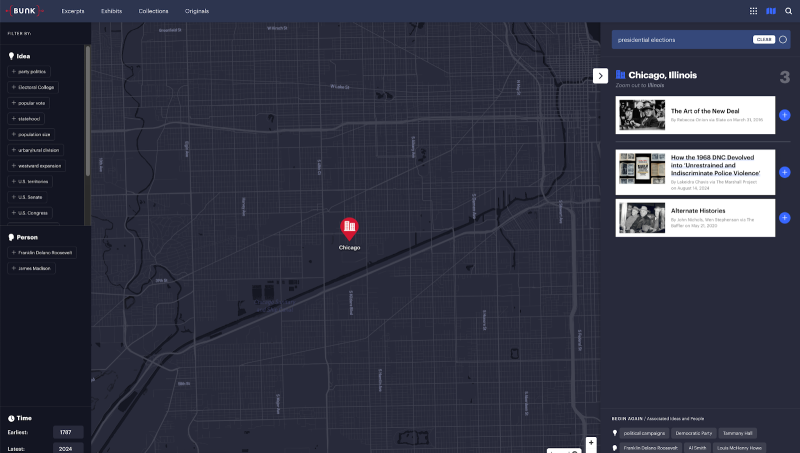
- What results do you notice when you search via Bunk Places using the map icon in the top right corner of the Bunk homepage?
Select one of the locations and explore the related content in Bunk.
Select 3-4 related excerpts in Bunk as you explore, and add them to a Bunk Collection, or use a Bunk Assignment as directed by your teacher. In addition to adding the Electing the President map, add at least 2-3 other print publications, audio or video-based content. Annotate your collection, summarizing key points from the text or content. Be sure to save and finalize your Collection or Assignment.
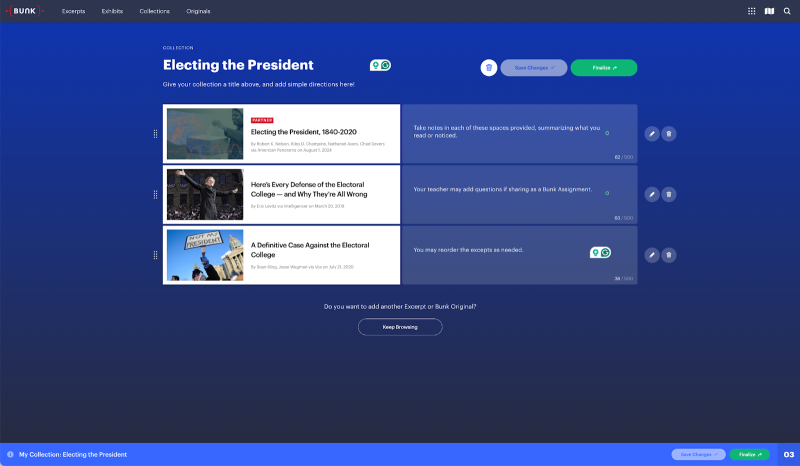
Share your Collection with a partner, or turn it in as an Assignment based on your teacher’s directions. We’d love to see your Collection. Your teacher may share the link with us via email: editor@newamericanhistory.org.
Your teacher may ask you to record your answers on an exit ticket.
Extend:
What other ways might you visualize data or use other forms of media to teach and learn about the presidents?
Now that you have explored maps as a way to visualize data, it is time to explore a few other ways you might share your newfound knowledge about all things POTUS!
Periodic Presidents is a fun site with creative infographics about the presidents, the Constitution and even the Electoral College. Select Student Resources from the menu bar at the top of their site, then select Presidents to explore more information about each one.
Each President has a unique infographic sharing biographical data and information about their presidency, arranged in a way similar to the Periodic Table of Elements you may have learned about in your science classes.
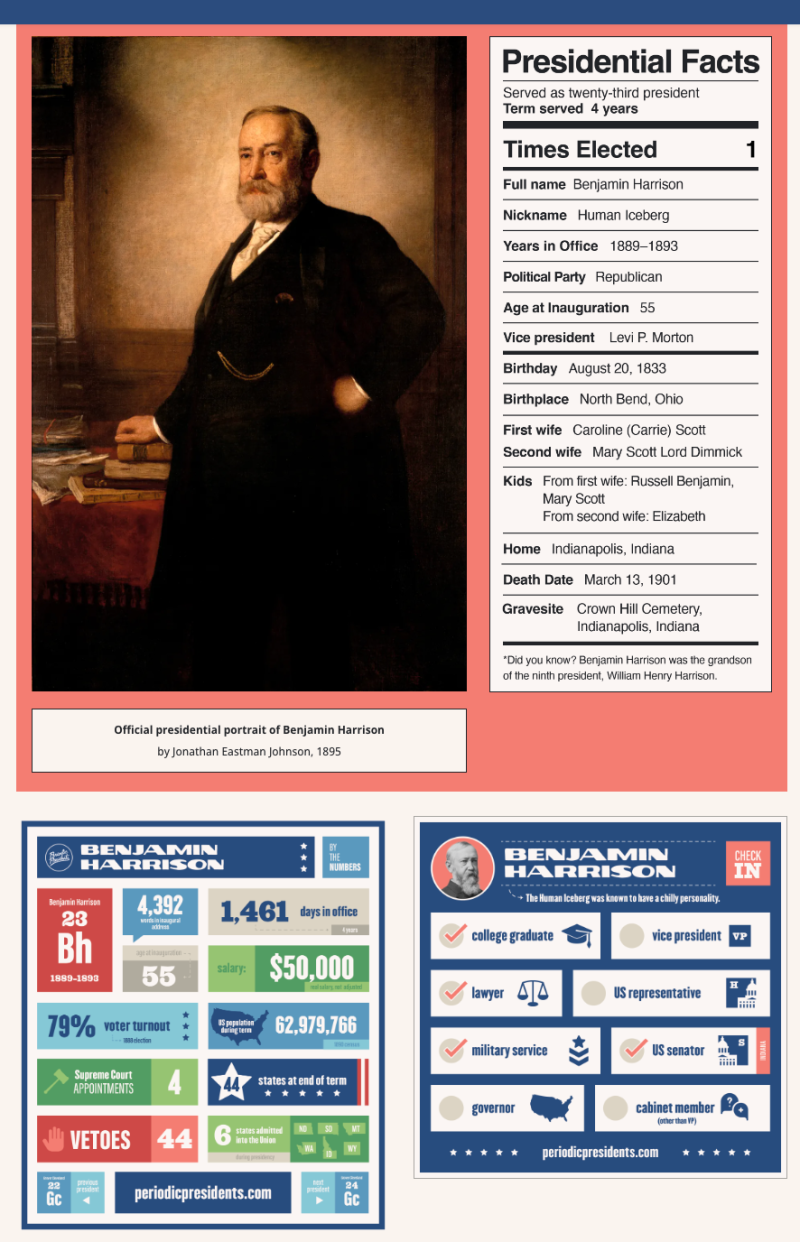
Select a president you are most curious about —we selected Benjamin Harrison.
You may watch a short video to learn more about the president you selected.

Benjamin Harrison with Periodic Presidents
Join Bobblehead George and Periodic Presidents for a look at POTUS #23, Benjamin Harrison! Benjamin Harrison came from a long line of influential Americans. His dad, John Scott Harrison was a Congressman, his grandfather was famed general and 9th President William Henry Harrison, and his great grandfather, Benjamin Harrison V was a signer of the declaration of independence.
www.youtube.com
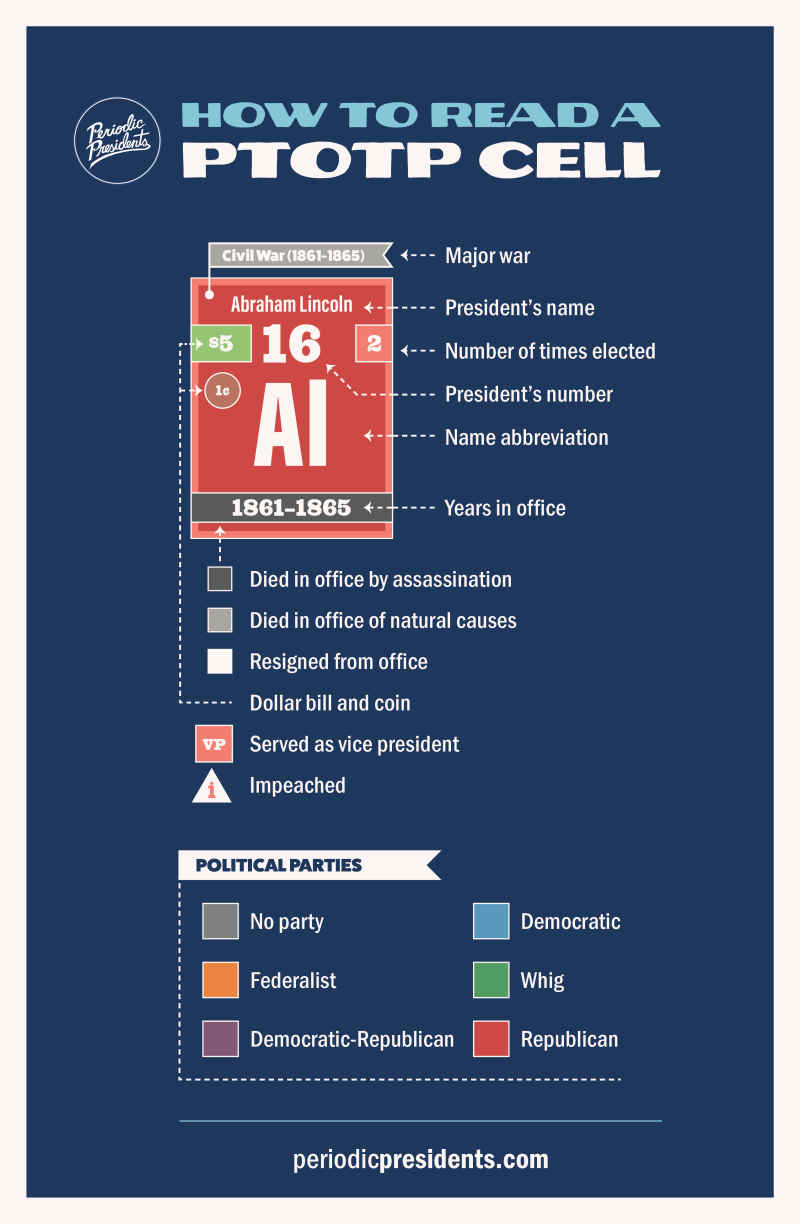
Next, analyze the Periodic President infographic for the president you selected.

Select “How to read this cell” for a diagram explaining how the Periodic Presidents data is shared - the “PTOTP” or Periodic Table of the Presidents.
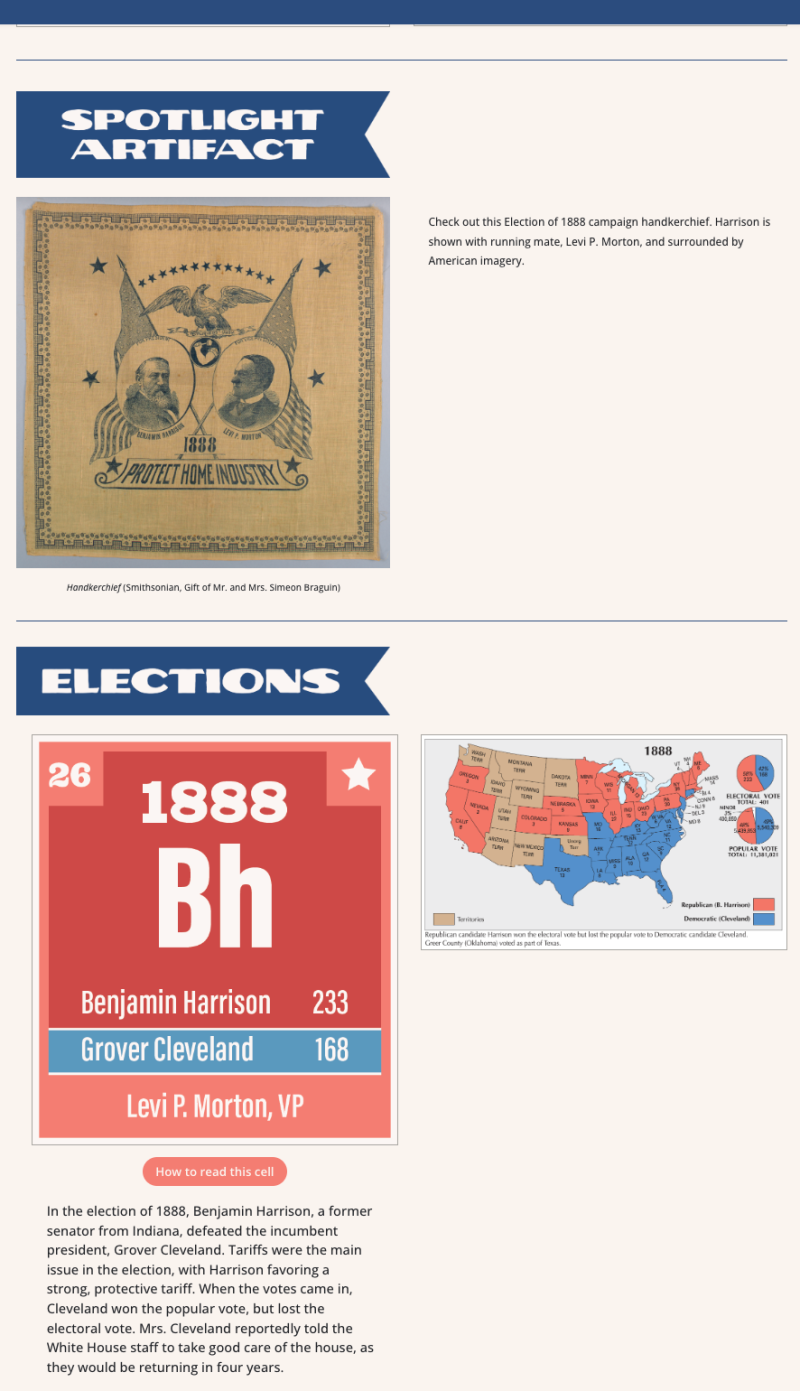
Return to the main page for the President you selected to find more information, images, infographics, maps and links about your president.
The Periodic Presidents also make awesome posters you can download and print while listening to the Civics 101 podcast, or purchase from their site. There’s a fun book, too—ask your school librarian to order a copy for your school library!
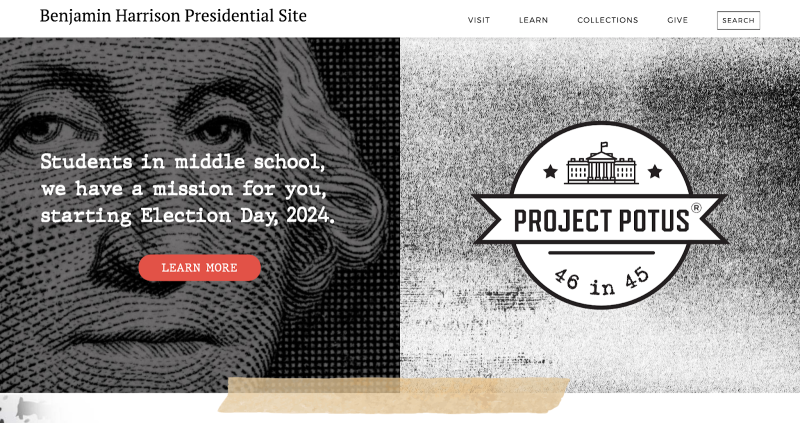
Now that you are a “Presidential Expert,” if you are a middle school student, you may want to join Project POTUS, sponsored by our friends at the Benjamin Harrison Presidential Historic Site.
Project POTUS is a video-based competition. Be sure to read all of the contest rules and information before accepting the challenge.
If you are in middle or high school, you may choose to use all of the information you have learned about the presidents using the Electing the President map, Bunk or Periodic Presidents to enter other academic competitions such as National History Day, We The People, or similar academic competitions and projects.
Your teacher may ask you to record your answers on an exit ticket.
Citations:
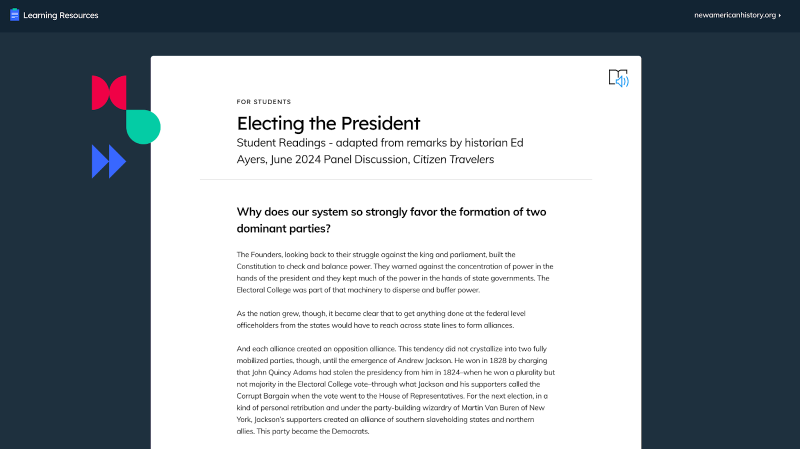
Ayers, Edward L. “How We Elect Our President: The Electoral College and Two-Party System,” Remarks delivered to Citizen Travelers at the Travelers Institute: Gilder Lehrman Webinar. June 25, 2024. https://www.travelers.com/travelers-institute/webinar-series/symposia-series/electoral-college-two-party-system.
Bischoff, Wyatt. “Cooperative Learning Fast Facts.” Exploring Exemplary Science Teaching, October 4, 2018. https://sites.miamioh.edu/exemplary-science-teaching/2018/10/cooperative-learning-fast-facts/.
Civics, minus the headache. “Electoral College Explained.” YouTube, September 1, 2023. https://www.youtube.com/watch?v=uqHW0sK7XOo .
Donnell, Henry Clay, and Britton & Rey. The presidential elections of the United States. [Washington?: U.S. Election Map Co, 1877] Map. https://www.loc.gov/item/2012586608/.
Drollinger, Mark. “Jigsaw”. YouTube, Nov 27, 2015. https://www.youtube.com/watch?v=KzJpVE-fQeE
Gonzalez, Jennifer. “4 Things You Don’t Know about the Jigsaw Method.” Cult of Pedagogy, July 18, 2024. https://www.cultofpedagogy.com/jigsaw-teaching-strategy/ .
Gonzalez, Jennifer. “The Jigsaw Method.” YouTube, April 15, 2015. https://www.youtube.com/watch?v=euhtXUgBEts .
Hartig, Hannah & Daniller Andrew. “Republican Gains in 2022 Midterms Driven Mostly by Turnout Advantage.” Pew Research Center, July 12, 2023. https://www.pewresearch.org/politics/2023/07/12/voter-turnout-2018-2022/ .
National Popular Vote, April 15, 2024. https://www.nationalpopularvote.com/ .
“NSTA and National Teacher Organizations Release Joint Position Statement on Data Science.” NSTA. Accessed August 26, 2024. https://www.nsta.org/press-release/nsta-and-national-teacher-organizations-release-joint-position-statement-data-science .
Periodic Presidents, June 12, 2024. https://periodicpresidents.com/ .
“Project POTUS.” Benjamin Harrison Presidential Site, April 30, 2024. https://bhpsite.org/project-potus/ .
“Ranked-Choice Voting (RCV).” Ballotpedia. Accessed August 26, 2024. https://ballotpedia.org/Ranked-choice_voting_(RCV) .