
This work by New American History is licensed under a Attribution-NonCommercial-ShareAlike 4.0 (CC BY-NC-SA 4.0) International License. Permissions beyond the scope of this license may be available at newamericanhistory.org.
Southern Journey: The Restless South, 1860–1940
A collaboration with Seizing Freedom and VPM
Read for Understanding
The South witnessed massive migrations in the four generations after the Civil War—probably, in total, the largest the nation has ever seen. Yet the basic patterns of racial division established by slavery endured through the devastating changes of war, emancipation, the Great Migration, and the Great Depression. Despite all the journeys, most Black Americans still lived where they had lived before freedom: in the Black Belt that traced a path across the Lower South and in the plantation districts that lined the Mississippi River. Using digital mapping tools, this learning resource visualizes these patterns of migration in ways previously not seen.
Key Vocabulary
Black Belt - a region of highly fertile black soil in the American South that was the center of slavery, and continues to have a large black population into the 21st century
Cartographer - a mapmaker, a person who draws or produces maps
Cataclysmic - an event that changes a situation or society greatly, especially in an unpleasant way
Census - an official count or survey of a population, typically recording data about individuals used for government planning and research
Cessions - The assignment of property to another entity. In international law, it commonly refers to land transferred by treaty
Chattel slavery - the enslaving and owning of human beings and their offspring as property, able to be bought, sold, and forced to work without wages
Commerce - the activity of buying and selling, especially on a large scale
Contraband - a property that is illegal to own or transport/smuggle; during the U.S. Civil War, a term used to describe escaped enslaved Africans given sanctuary by Union forces who declared them goods that may not be supplied by people who are neutral in a war
Emancipation - to free from control, or the power of another- especially to free from bondage
Expulsion - the process of forcing someone to leave a place, especially a country, the forced removal of people from a location
Geospatial - relating to data that is associated with a particular location
Great Depression - a severe worldwide economic downturn that took place mostly during the 1930s, beginning in the United States, following the 1929 Stock Market crash
Great Migration - relocation of hundreds of thousands of African Americans from the rural areas of the South to urban areas in the North, South, and West during the years between 1915 and up until 1970
Hamlets - communities smaller than a village, town, or parish, usually rural or just outside a city
Human settlement - A location where people have built structures to use as permanent or temporary living areas
In-migration - the process of people moving into a new area in their country
Migration - the movement of people to a new area or country to find work or better living conditions
Movement - Over time, physical and human phenomena change locations on the Earth’s surface
Out-migration - the process of people moving out of an area in their country to live in another area in their country
Population - all the inhabitants of a particular town, area, or country
Population Density - the number of people per square mile of land area
Refuge - a condition of being safe; shelter from pursuit, danger, or harm (people who seek or take refuge are called refugees)
Settler colonialism - refers to the displacing or forcing out the native populations of a region or territory
Settler-Slave Society - a form of settler colonialism involving the practice of ownership and forced labor of chattel slaves
Spatial - how objects fit together, either among the planets or on the earth's surface.
Storymap - a web-based map integrating maps, legends, text, images, and multimedia elements to help users explore content and visualize data
Urban - related to a city or large town, usually more densely populated
Engage:
What role did geography play in the lives of the enslaved populations in the east and west in the decade of war and emancipation from 1860-1870?
During the Civil War enslaved African Americans looked for opportunities to gain their own freedom. Some, like Harry Jarvis, made their way to Union Army posts seeking refuge in Contraband Camps. In this excerpt from the Seizing Freedom podcast, you will hear of Harry’s daring escape from his enslaver to the protection of Ft. Monroe. (Listen to a segment from Seizing Freedom, “A Powerful Black Hand,” from 00:16 to 03:29).
A Powerful Black Hand
This is an excerpt from the VPM's "Seizing Freedom" episode, "A Powerful Black Hand" (https://www.seizingfreedom.com/). The excerpt is edited for use with New American History.
soundcloud.com
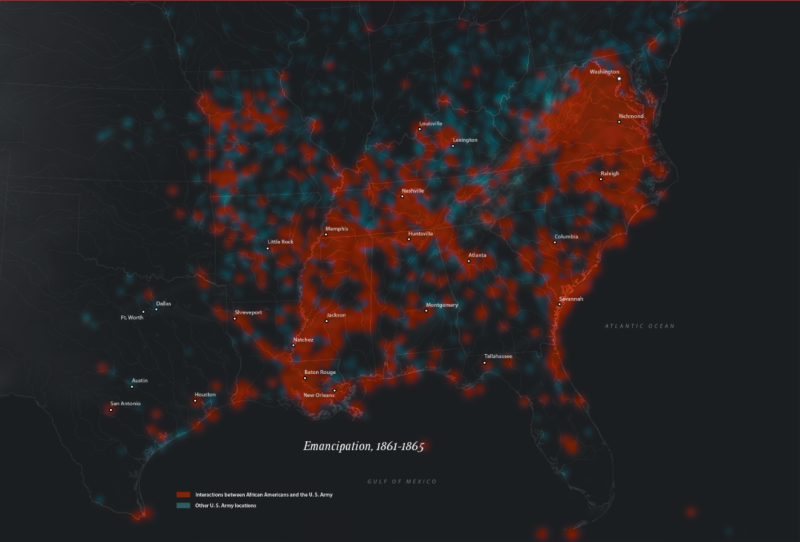
While most enslaved people were not in close enough proximity to seek refuge at a Union army camp, those who took advantage of their proximity between 1860 - 1863, like Harry Jarvis, joined a growing number of protected Black refugees in the Union contraband camps. This StoryMap illustrates the patterns of the enslaved seeking refuge in the Union forts and contraband camps. Take a few minutes to explore the heat map of Emancipation, 1861–1865, and the animated maps of the Eastern and Western Refugee Camps.

The Restless South, 1860-1940
Southern Journey: Migrations of the American South, 1790-2020
storymaps.arcgis.com
1/2
- Using the heat map, what patterns do you notice?
- How do the interactions between the enslaved and the Union Soldiers vary by geographic location?
- What connections do you see to the areas indicated in red on the heat maps and their proximity to bodies of water?
- What patterns do you see as you explore those areas indicated in red and their location to cities?
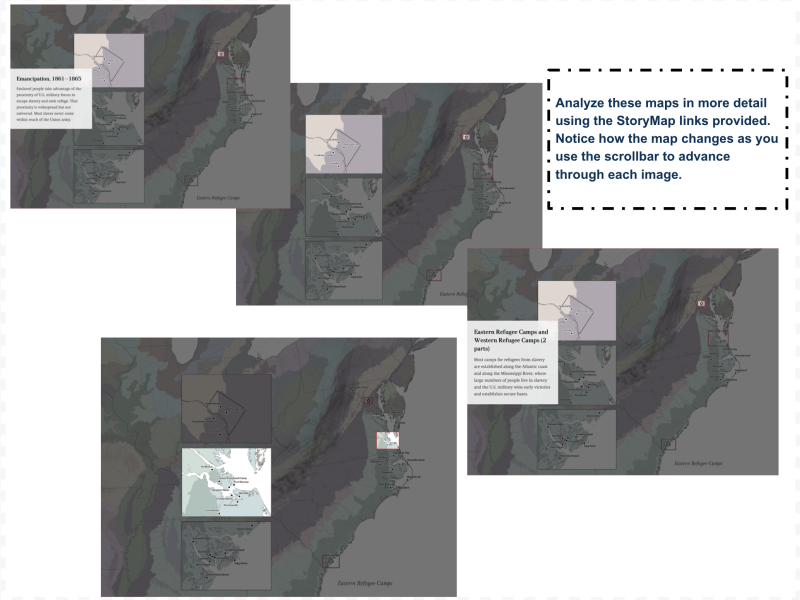
Continue to scroll through the StoryMap, taking time to analyze the animated maps of the Eastern and Western Refugee Camps. (See the second image in the Gallery above to help you find the Refugee maps in the StoryMap.)
- Comparing and contrasting the maps from both the Eastern and Western Refugee Camps, what similarities do you notice?
- What patterns do you see when comparing the locations of each camp in their relationship to bodies of water?
- What evidence might you use to explain these patterns?
Next you will view a video segment that further explores the story of the Contraband Camp at Ft. Monroe. As you view the video, think back to the story of Harry Jarvis from the Podcast. Use the KWL chart to help you organize your thoughts. Before you view the video, take a few minutes to complete the K (Know) and W (Want to Know) sections of the chart, based on the podcast you listened to, and the maps you explored earlier.
NAH KWL chart
Print or make a digital copy of this chart to record your thoughts, ideas, and answers. K W L What I know … What I want to know / wonder ... What I learned …
docs.google.com
(View segment, “Making Freedom’s Fortress,” from the New American History website.) When you have finished, complete the L (Learned) column of your chart.
Your teacher may ask you to share your KWL chart as an exit ticket.
Explore:
What migration patterns emerged during the decade of war and emancipation, and how do these patterns change as small towns grew with the expansion of the railroad?
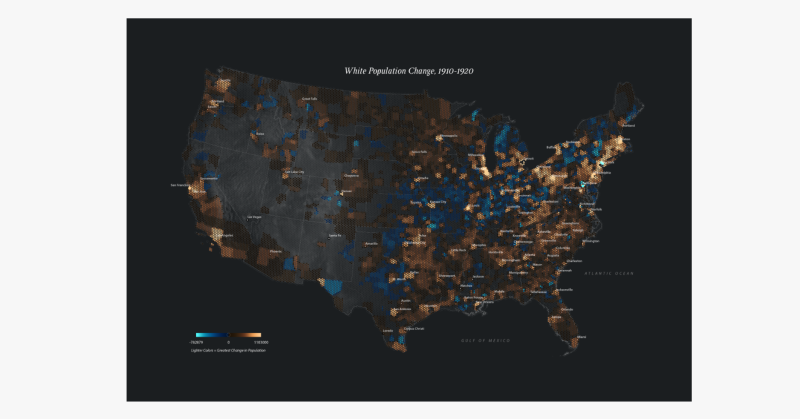
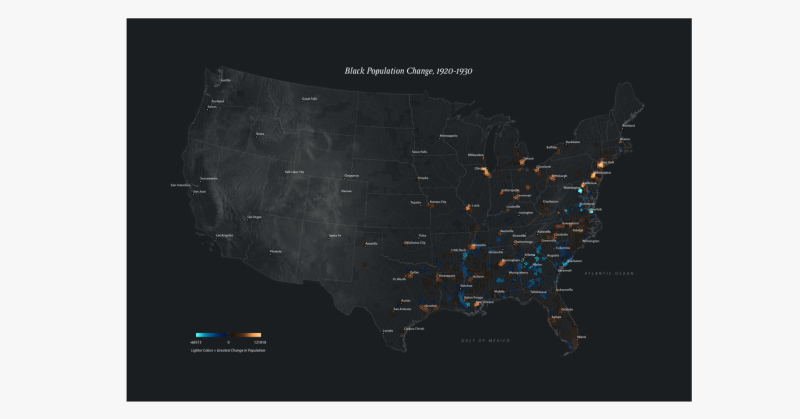
This StoryMap contains numerous maps comparing and contrasting the White population and Black population of the United States from 1860 to 1940. Some are presented as individual maps which may also be examined in closer detail as pop-out maps, while others use a vertical time sliding tool for comparison. You will spend the majority of your time in this portion of the Learning Resources analyzing these maps, comparing and contrasting the patterns you see between both population subgroups. Remember to slow down and take your time as you scroll through each map. Take time to read the captions for each map. Pay close attention to the use of color on the maps. The maps show clear and striking patterns: shades of copper in the places where the number of people increased (in-migration) and those in blue where they declined (out-migration). The brighter the colors, the greater the change. The captions describe the most important patterns in each map. (Note, the gallery images below only represent a portion of the maps you will need to view in the online StoryMap, so be sure to locate and analyze all of the maps which appear with the black, copper, and blue color scheme.)
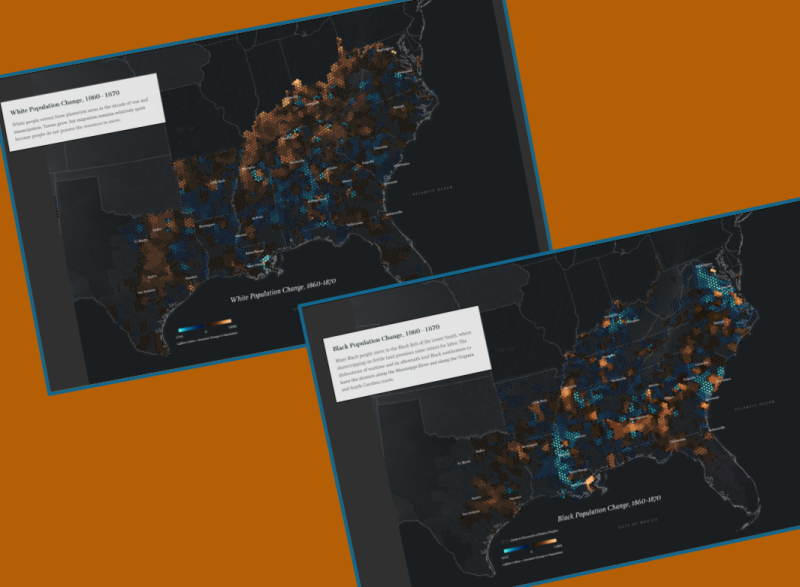
- Analyzing the maps of the White population and Black population between 1860-1870, what do you notice?
- Where do you see the areas of greatest growth, or in-migration (copper)?
- What areas experience the most out-migration (blue)?
- How do these migration patterns compare to the maps of the Contraband camps in the earlier part of the maps?
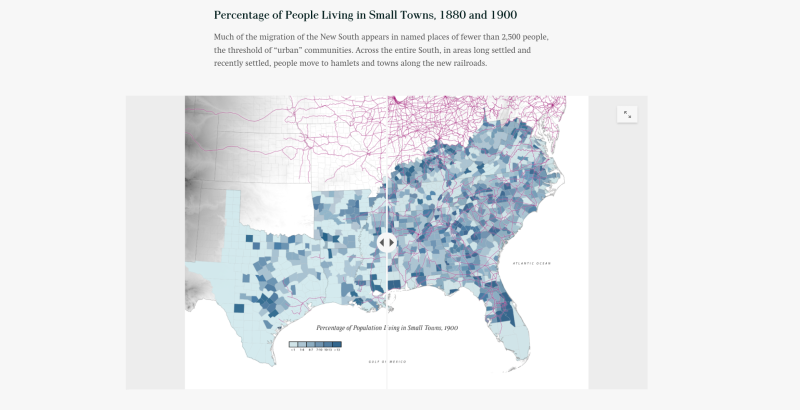
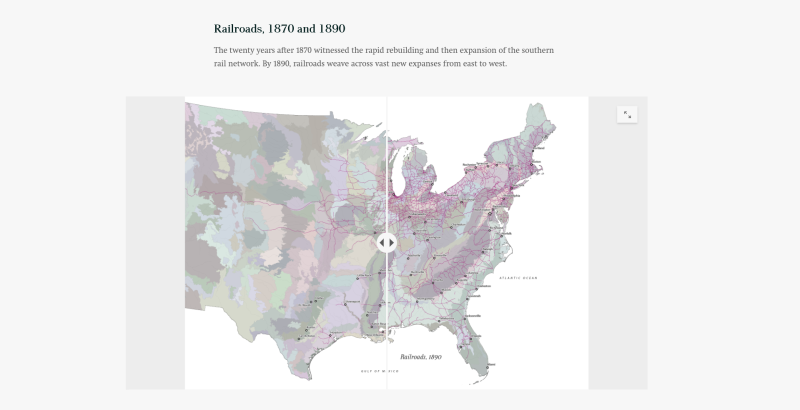
Continue to scroll through the StoryMap, exploring the maps of “Percentage of People Living in Small Towns, 1880 and 1900,” and “Railroads, 1870 and 1890.”
Be sure to view the maps in the online StoryMap, carefully reading all captions and using the slider tool to compare and contrast the growth of small towns and transportation links across the South in the decades following the Civil War.
storymaps.arcgis.com
1/2
Turn and talk to a partner, or if working in a remote learning environment, your teacher may allow you to use the chat feature, a breakout room, or a collaborative document to share your thoughts and ideas.
- How does the growth of small towns compare between 1880 and 1900?
- What patterns do you notice?
- Examining the map of “Railroads, 1870 and 1890” how would you describe the growth of railroads over the decades?
- How might you describe the relationship between the growth of cities and small towns along the railroad?
- Where might you predict there will be further growth? Explain your ideas to your partner.
Your teacher may ask you to record your answers on an exit ticket.
Explain:
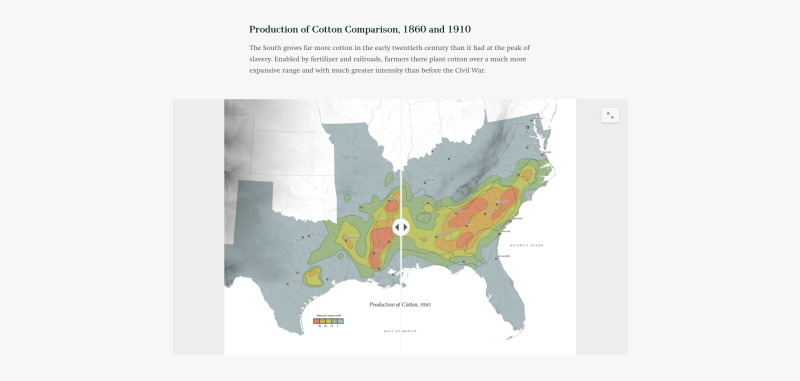
In what ways did cotton production influence migration in the New South following the end of the Civil War to the turn of the century?
This map uses a slider tool similar to the ones found earlier in these Learning Resources. Use the slider tool to examine the changes in cotton production in the New South, or the southern United States following the end of the Civil War. Be sure to view the map on the StoryMap to compare and contrast cotton production across the decades. You may also compare the map of cotton production to the previous railroad map.
1/2
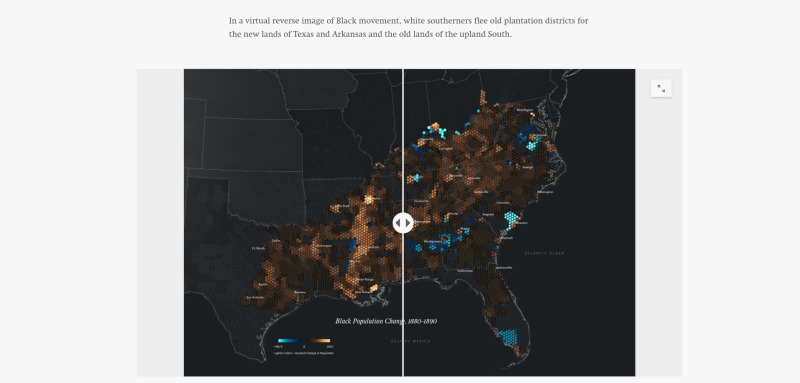
Now use the migration maps of Southern Journey to analyze shifts of Black and White populations in the New South between 1880-1890. Scroll back up through the StoryMap to compare these changes to the earlier maps you examined of Small Towns, Railroads, and Cotton Production.
Remember to view the maps as they appear in the interactive StoryMap, not just the image gallery. Take time to look at the migration and outmigration, as indicated by the blue and copper coloration on the maps. Use the buttons to zoom in on the White population shifts in Texas and Appalachia.
- What new economic opportunities did Black and White Americans pursue?
- What connections do you see on the maps between the cotton production in 1880-1890, and other population shifts in the New South?
Continue to scroll down and analyze each decade, looking for more patterns from 1890-1900 and 1900-1910.
- What do you notice?
- What areas on the maps seem to have the largest western migration?
- What areas on the maps seem to have shifted from urban to rural, or rural to urban migration?
- How might economics and technology have an impact on these patterns?
- How do you think geographers during this era might explain the Black Belt?
- Where might you look for more information about cotton production or migration patterns?
Your teacher may ask you to record your answers on an exit ticket.
Elaborate:
What changes in population patterns continue to occur in the early 20th century as a result of fluctuations in cotton production, and the Great War?
In the late 1800s-early 1900s a new enemy emerged in the Cotton Belt, the Boll Weevil.
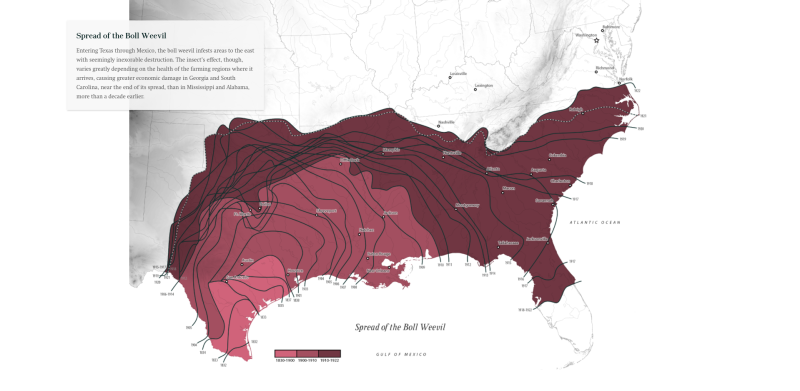
View this animated video on the history of the Boll Weevil, and how this tiny pest changed American farming in the Cotton Belt of the south.
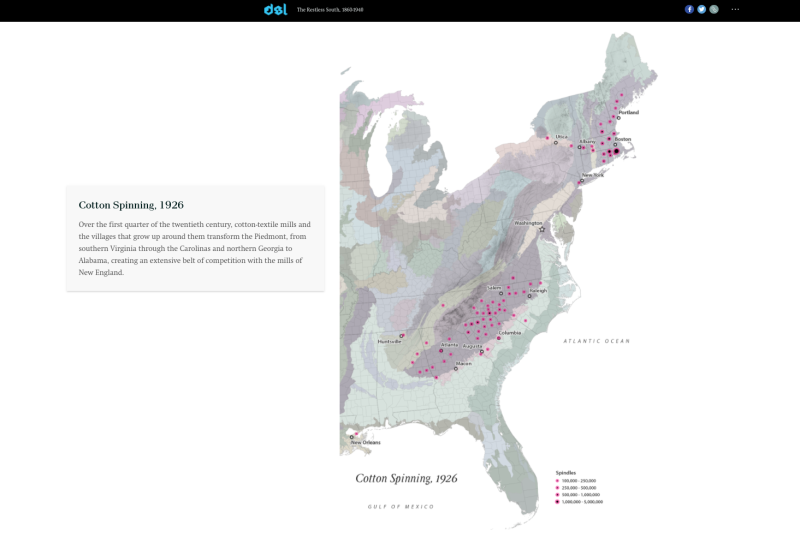
Despite the challenges faced by the farmers with the Boll Weevil, cotton remained a top economic priority for American industries, with textile mills growing in both the South and the Northeast. Some jobs shifted from agriculture to millwork, and young girls and women often filled those positions. Compare this map of Cotton Spinning, 1926 to the migration maps of Black and White populations between 1910-1920. Remember to view the maps in the StoryMap by scrolling down and using the pop-up map feature for a closer look at the maps.
- Do you notice any patterns between the cotton industry and migration patterns on the maps?
- Where do you see the most increases in outmigration?
- In what regions do you find the greatest increases in population?
Consult your school librarian, the local historical society of a history museum, or website to find out more about American cotton production in the early 20th century. The National Archives or Library of Congress is a great place to start, but your teacher may provide you with other resources.
Create an advertisement, either using paper and pencil or digital tools such as Google Slides to advertise and find mill workers to move to either the South or Northeast to increase production in the textile industry. Your teacher may allow you to share your work via a Gallery Walk or collaborative slide presentation.
We would love to see your work! Please share if your teacher or a trusted adult permits. You may email us at editor@newamericanhistory.org or share via social media (links on our pages). Be sure to tag us as you share!
Your teacher may ask you to record your answers on an exit ticket.
Extend:
How do increased transportation options and economics influence migration in the early to mid-20th century?
With the expansion of the railroads and new transportation options with the automobile come greater mobility for Black and White Americans. Scroll through the StoryMap to view the map of Railroads, Early Twentieth Century.
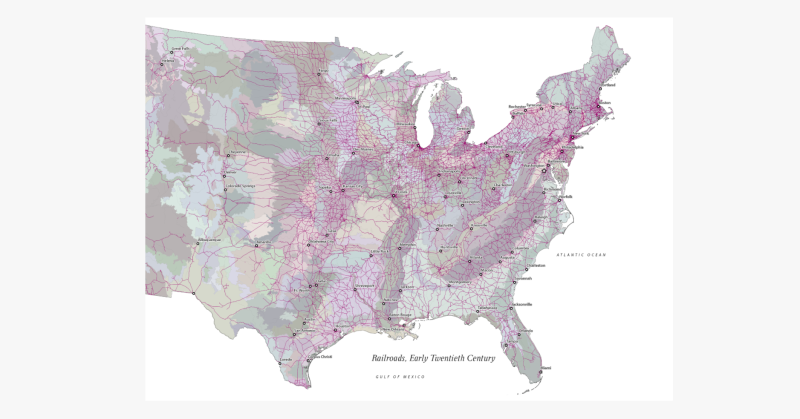
1/3
Now continue scrolling through the map to view the changes in the White Population between 1910-1920 and the Black Population, 1920-1930. Be sure to view the maps in the StoryMap, using the pop-out map feature and paying close attention to the captions for each map. Take time to look at the migration and outmigration, as indicated by the blue and copper coloration on the maps.
- What shift do you notice between the population maps and the expansion of the railroads?
- How might the automobile have influenced where people choose to live and work?
- Which economic and environmental forces influenced population shifts?
Continue scrolling through the StoryMap, and view the maps for population changes between 1930 and 1940 for both Black and White Populations. As the nation suffered an economic downturn, some Americans migrated in search of a job or better life for their families.
This oral history is an excerpt from the BackStory podcast archives. Listen to this description from “Looking for Work: The Great Migration.”
The Great Migration — Backstory Archive
William Brown moved north from Jacksonville, FL, during the Great Migration. He describes what happened when he asked a Philadelphia real estate agent for a job. Discussion of challenges for African Americans looking for work in the early 20th century.
backstory.newamericanhistory.org
- What follow-up questions would you like to ask Wiliam Brown?
- What questions might you ask the realtor who offered him the job?
- What pros/cons do you see for people like William Brown in making the decision to move?
With this Great Migration came not only population shifts, but changes in the social and economic stability of rural Appalachia, the ever-changing South, and growth in the Midwest and East. These will continue to be explored in the next portion of the StoryMap, Arrival and Return, 1940-2020.
Your teacher may ask you to record your answers on an exit ticket.
Citations:
Ayers, Edward L., Justin Madron, and Nathaniel Ayers. “Creating the American South, 1790-1860.” ArcGIS StoryMaps. American Panorama/Digital Scholarship Lab, University of Richmond. https://storymaps.arcgis.com/stories/3623b54371434be0b7612c87b8cc3f1f.
Ayers, Edward L., Justin Madron, and Nathaniel Ayers. Southern Journey the Migrations of the American South, 1790-2020. Baton Rouge: Louisiana State University Press, 2020.
Mai, Lina. “Use Historical Empathy to Help Students Process the World Today,” 2021. https://facingtoday.facinghistory.org/use-historical-empathy-to-help-students-process-the-world-today.
Richmond via Esri, November 9, 2020. https://storymaps.arcgis.com/stories/34e0e42dc461499f85b369b43f9e44f6.
Steinberg, Daniel. “Boll Weevil.” YouTube. Daniel Steinberg, March 10, 2021. https://www.youtube.com/watch?v=XbVhFdjtrKo.
"The Future Of America's Past: Freedom's Fortress." 2019. TV program. Field Studio. VPM: Virginia Public Media. https://futureofamericaspast.com.
“The Great Migration - Backstory Archive.” Looking for Work - Backstory Archive. Virginia Humanities, January 1, 1970. https://backstory.newamericanhistory.org/episodes/looking-for-work-a-history-of-unemployment/2/.