
This work by New American History is licensed under a Attribution-NonCommercial-ShareAlike 4.0 (CC BY-NC-SA 4.0) International License. Permissions beyond the scope of this license may be available at newamericanhistory.org.
Not Even Past: Social Vulnerability and the Legacy of Redlining
What are the long-term effects of New Deal housing policies on people’s health today?
Read for Understanding
Racial residential segregation may impact health through poor housing conditions, disparities in educational and employment opportunities, inadequate transportation infrastructure, access to healthcare, and economic instability. Where people live impacts their exposure to health-promoting resources and opportunities including access to quality food, recreation, and healthcare, as well as exposure to health-damaging threats such as environmental pollutants, poor housing quality, and food deserts. This learning resource examines the question, "Does where we determine our level of health and wellness?"
Key Vocabulary
Census tract - a region defined by the Census Bureau for population analysis
Demographic metrics - statistics that reflect the characteristics of a population
Generalization - a broad claim arrived at after bringing together specific examples
Home Owners’ Loan Corporation (HOLC) - an agency created in 1933 by U.S. President Franklin D. Roosevelt’s New Deal that attempted to prevent foreclosures by refinancing home mortgages in default; created a color-coded grading system that assessed the credit-worthiness of city neighborhoods
Public health - the science of protecting and improving the health of communities through education, policy-making, and research
Redlining - the practice of mortgage lenders drawing red lines around portions of a map to indicate areas or neighborhoods considered to be high risk for loan default
Social vulnerability - a community's exposure to potential external stresses on human health
Social Vulnerability Index - a measurement of social vulnerability using U.S. Census data
Engage:
What is the connection between where we live and our physical health?
To think more about the connections between where we live and how healthy we are, you will analyze the image below from the Library of Congress collection. Using the Analyzing Images protocol from Facing History, your teacher will lead you in a discussion about the photograph.
- Spend some time carefully examining the photograph. Take note of people, objects, messages, landmarks, etc.
- Write down everything you see without any analysis. Just list what you see.
- What questions do you have about the image that if you knew the answers, would help you interpret the photograph?
- Turn and talk to a neighbor or two to try to find some of those answers.
- Why do you think this photograph was taken and is now in the Library of Congress collection? What do you think was significant about this event?
- In a whole class discussion, share your interpretation of the photo while referring to specific aspects of the image as well as the historical context you know.
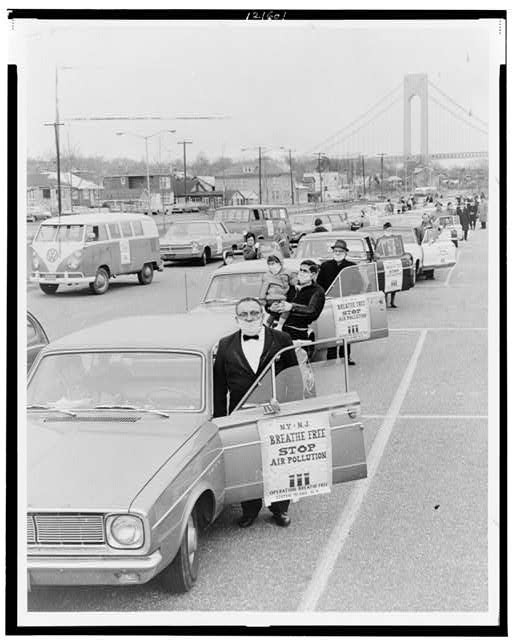
How does this 1967 photograph help us understand the connection between where we live and our physical health?
Your teacher may ask you to record your answers on an exit ticket.
Explore:
What is the connection between government policies and long-term health outcomes?
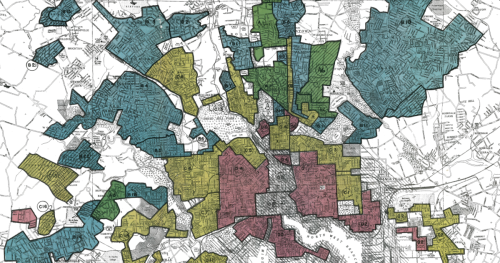
During the 1930s, the federal government established the Home Owners’ Loan Corporation (HOLC) to help lenders make informed decisions about the creditworthiness of homeowners during the Great Depression. The HOLC created color-coded maps of cities across the country, grading each neighborhood according to how risky it was deemed for banks to offer loans there. Neighborhoods coded red were considered to be the riskiest investment for mortgage lenders. This system effectively disadvantaged areas predominantly inhabited by Black residents, immigrants, and certain ethnic groups. This practice later came to be known as “redlining.”
Listen to this NPR story about how the redlining policies of the past affect the present, and complete this listening guide as you follow along.
In U.S. Cities, The Health Effects Of Past Housing Discrimination Are Plain To See
Researchers analyzed the lingering harms of of decades-old racist lending policies known as redlining. Their project lets you explore the current impacts on maps of 142 cities.
www.npr.org
Spend some time exploring the history of redlining as depicted in the digital scholarship project Mapping Inequality, and other connections in Bunk.
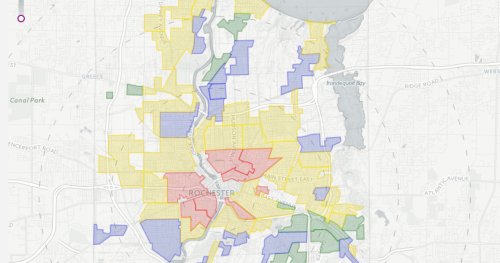
Mapping Inequality: Redlining in New Deal America
A set of maps that illustrate the discriminatory New Deal-era housing policies that fueled generations of urban inequality.
www.bunkhistory.org
You may explore the Bunk tag for “redlining” in the connections card view, or search a geospatial view, by selecting “View on Map.”
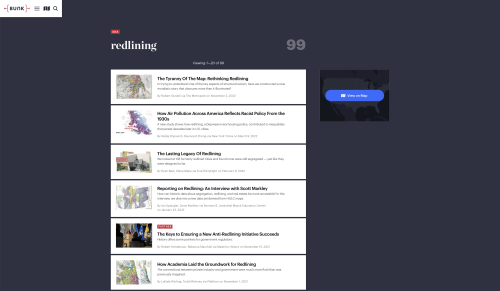
Bunk Tag-Redlining, View Connections
Rewiring American History
www.bunkhistory.org
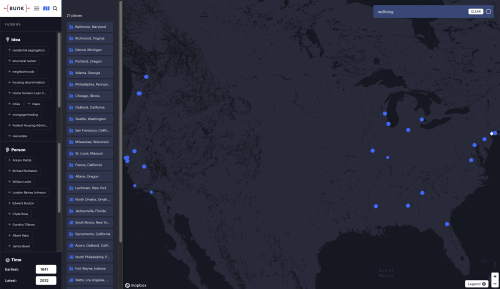
Bunk Tag-Redlining, View on Map
Rewiring American History
www.bunkhistory.org
- Do you prefer one view over the other?
- How is each of these views the same?
- How are they different?
- Which view helps you understand redlining in a new or different way?
Your teacher may ask you to record your answers on an exit ticket.
Explain:
How does access to affordable housing and healthcare improve the overall quality of life from one generation to the next?
- “Not Even Past” is a digital mapping project exploring the connections between redlining and long-term public health outcomes. It uses the Centers for Disease Control’s Social Vulnerability Index (SVI), which measures how well a community can prepare for, respond to, and recover from human and natural disasters. Examining this data reveals patterns across communities, which can be the first step toward equitable solutions for various public health problems.
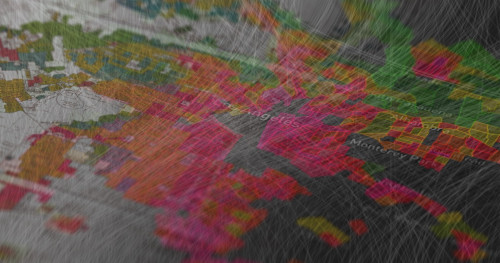
Not Even Past: Social Vulnerability and the Legacy of Redlining
Not Even Past maps redlining maps from the 1930s with maps of health dispartities today, showing enduring contours of marked inequality in American cities over the past century.
dsl.richmond.edu
Navigate to the “Not Even Past” project and spend some time reading the introduction. Answer the questions below.
- What does the introduction to “Not Even Past” make clear about the effect of racial residential segregation on health?
- What data does the “Not Even Past” digital mapping project compare?
- When you select a city/town, what map will be on the left side? What map will be on the right side?
- What does the diagram between the maps show?
Revisit the “Operation Breathe Free” photograph you analyzed earlier in the Engage portion of this learning resource. Continue your thinking about the connection between where we live and our physical health.

Next, below the introduction, you will choose a few cities to learn more about. The cities in this menu correspond to those that were mapped by the Home Owners Loan Corporation and that you previously considered in the Explore section of this learning resource.
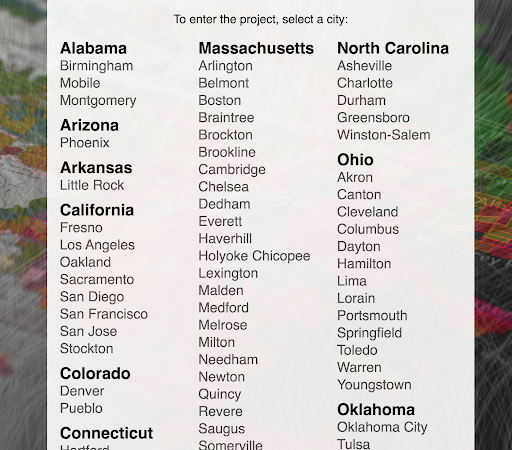
Once you have selected 2-3 cities to explore, complete this graphic organizer to further analyze the legacy of redlining on social vulnerability.
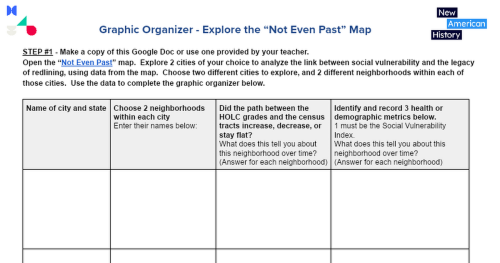
NAH Graphic Organizer -Explore the "Not Even Past" map
STEP #1 - Make a copy of this Google Doc or use one provided by your teacher. Open the “Not Even Past” map. Explore 2 cities of your choice to analyze the link between social vulnerability and the legacy of redlining, using data from the map. Choose two different cities to explore, and 2 differ...
docs.google.com
Your teacher may ask you to record your answers on an exit ticket.
Elaborate:
What connections might we make between redlining and current public health crises in the present day?
Visit this annotated collection of resources on Bunk that helps explain the long history of housing discrimination.
Redlining is Only Part of the Story
An annotated collection of resources from the Bunk archive that help explain the long history of housing discrimination.
www.bunkhistory.org
In the narrative that accompanies the collection of resources, Dr. Julian Maxwell Hayter writes:
“It wasn’t merely the federal government that segregated America. The real estate industry, private lenders, city planners, and even institutions of higher education also helped reinforce the biases that characterize housing discrimination. Vulnerable communities still feel the impacts of this profitable disinvestment in vast and far-reaching ways.”
As you read the narrative by Dr. Hayter, look for the connections between segregationist housing policies and the date you explored on the map using the social vulnerability index. Then, choose one of the articles he includes in the Bunk collection that relates to public health to read and analyze.
When you finish reading the article you chose, complete this Connect, Extend, Challenge graphic organizer to help you process your thinking.
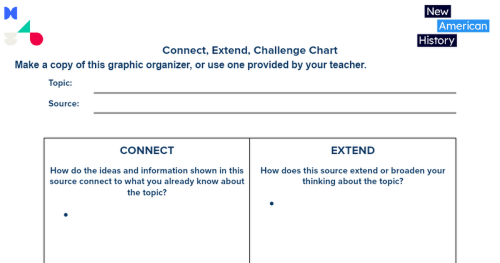
NAH Connect, Extend, Challenge Chart
Connect, Extend, Challenge Chart Make a copy of this graphic organizer, or use one provided by your teacher. Topic: Source: CONNECT How do the ideas and information shown in this source connect to what you already know about the topic? EXTEND How does this source extend or broa...
docs.google.com
Your teacher may ask you to record your answers on an exit ticket.
Extend:
“Now that we know, what do we do about it?”
The reading you have done points to some of the ways that urban environments affect the health of their residents. Richmond, Virginia resident Torey Edmonds was interviewed in the NPR story you listened to about the health effects of housing discrimination. At the conclusion of the segment, she said:
“We talk about it, we research it, and my question is, now that we know… what do we do about it?”
What is an issue in your community that affects people’s health? With support from your teacher, search local news outlets for stories about public health in your area. Create an infographic or SketchQuote/SketchNotes that you can share to inform the public about the local issue you select. Canva and Visme are free apps with many templates that may help you get started, or you might design one using Google Slides.

What Is an Infographic?
An infographic is a big picture that summarizes a topic. It is a one-page publication that presents information in a graphic way. It's a great way for students to share their knowledge about a topic using Google Sites.
www.technokids.com
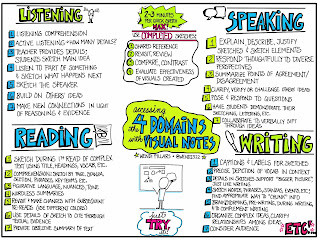
NAH Sketchquotes/Sketchnotes
“SketchQuotes” and Sketchnotes One of our favorite notetaking strategies is using SketchNotes. SketchNotes is a visual notetaking strategy combining elements of handwritten fonts (word art) and iconography (doodles meet emojis!), organizing your ideas as you learn new information. You do NOT ...
docs.google.com
We would love to see your work! Share your infographic, SketchQuote, or SketchNotes with us at editor@newamericanhistory.org, if your teacher or a trusted adult permits. You may also share via social media (links on our pages). Be sure to tag us as you share!
Your teacher may ask you to record your answers on an exit ticket.
Citations:
Black, Matthew. The masked "Operation Breathe Free" motorcade prior to departure from South Beach, S.I. / World Journal Tribune photograph by Matthew Black. New York, 1967. Photograph. https://www.loc.gov/item/98515556/.
Digital Scholarship Lab. “Mapping Inequality,” American Panorama, ed. Robert K. Nelson and Edward L. Ayers, accessed July 20, 2022, https://dsl.richmond.edu/panorama/redlining.
Digital Scholarship Lab, “Not Even Past: Social Vulnerability and the Legacy of Redlining,” American Panorama, ed. Robert K. Nelson and Edward L. Ayers, accessed July 21, 2022, https://dsl.richmond.edu/socialvulnerability/.
Godoy, Maria. “In U.S. Cities, the Health Effects of Past Housing Discrimination Are Plain to See.” NPR. NPR, November 19, 2020. https://www.npr.org/sections/health-shots/2020/11/19/911909187/in-u-s-cities-the-health-effects-of-past-housing-discrimination-are-plain-to-see.
Hayter, Julian Maxwell. “Redlining Is Only Part of the Story.” Bunk. New American History, October 5, 2022. https://www.bunkhistory.org/resources/10722.
Love, Christina. “What is an infographic?” TechnoKids Blog. TechnoKids, April 16, 2020. https://www.technokids.com/blog/desktop-publishing/what-is-an-infographic/.