

This work by New American History is licensed under a Attribution-NonCommercial-ShareAlike 4.0 (CC BY-NC-SA 4.0) International License. Permissions beyond the scope of this license may be available at newamericanhistory.org.
Renewing Inequality: Urban Renewal in Post-WW2 America
How did the federal government’s post-WWII-era urban renewal program reshape large and small cities?
View Student Version
Standards
Common Core:CCSS.ELA-LITERACY.RH.11-12.7Integrate and evaluate multiple sources of information presented in diverse formats and media (e.g., visually, quantitatively, as well as in words) in order to address a question or solve a problem.
C3 Framework:D2.His.3.6-8. Use questions generated about individuals and groups to analyze why they developed, and the developments they shaped, are seen as historically significant.D2.His.3.9-12. Use questions generated about individuals and groups to assess how the significance of their actions changes over time and is shaped by the historical context.
National Council for Social Studies:Theme 2 - TIME, CONTINUITY, AND CHANGETheme 5 - INDIVIDUALS, GROUPS, AND INSTITUTIONS
National Geography Standards: Standard 1 - How to use maps and other geographic representations, geospatial technologies, and spatial thinking to understand and communicate informationStandard 12 - The processes, patterns, and functions of human settlement
EAD FrameworkTheme: Institutional and Social Transformation Design Challenge: Motivating Agency, Sustaining the Republic
Teacher Tip: Think about what students should be able to KNOW, UNDERSTAND and DO at the conclusion of this learning experience. A brief exit pass or other formative assessment may be used to assess student understandings. Setting specific learning targets for the appropriate grade level and content area will increase student success.
Suggested Grade Levels: High School (9-12)
Suggested Timeframe: 3 or 4 class periods of 45–50 minutes each
Suggested Materials: Internet access via laptop, tablet, or mobile device
Key Vocabulary
Blighted - any area that endangers the public health, safety or welfare; or any area that is detrimental to the public health, safety, or welfare because commercial, industrial, or residential structures or improvements are dilapidated, or deteriorated or because such structures or improvements violate minimum health and safety standards
Conscious - to have knowledge or be aware of something
Displacement - the forced departure of people from their homes or land
Fragmentation - the process of being broken into small or separate pieces
Home Owners’ Loan Corporation (HOLC) - an agency created in 1933 by U.S. President Franklin D. Roosevelt’s New Deal that attempted to prevent foreclosures by refinancing home mortgages in default; created a color-coded grading system that assessed the credit-worthiness of city neighborhoods
Inequality - when some people have more opportunities, money, or advantages than other people
Inevitable - certain to happen, unavoidable
Market forces - the economic factors affecting the price of, demand for, and availability of a natural resource or manufactured product
Raze - to demolish
Redlining - The practice of denying a housing loan because of the home’s neighborhood The term refers to the practice of mortgage lenders of drawing red lines around portions of a map to indicate areas or neighborhoods in which they do not want to make loans
Rural - areas which are not towns or cities or suburbs, often farming or agricultural areas
Spatial thinking - the knowledge, skills, and habits of mind to use concepts of space, tools of representation like maps and graphs, and processes of reasoning to organize and solve problems
StoryMap - a web-based map integrating text, images, and multimedia elements to help users explore content and visualize data
Suburbs - an area outside of a city that is primarily residential
Urban - related to a city or large town, usually more densely populated
Urban Renewal - publicly-funded rehabilitation of poorly maintained city areas with new housing, public buildings, parks, roadways, and industrial areas, often resulting in the displacement of former residents
Read for Understanding
Teacher Tips:
This Learning Resource includes language in the body of the text to help adapt to a variety of educational settings, including remote learning environments, face-to-face instruction, and blended learning.
If you are teaching remotely, consider using videoconferencing to provide opportunities for students to work in partners or small groups. Digital tools such as Google Docs or Google Slides may also be used for collaboration. Rewordify or WordTuneRead helps make a complex text more accessible for those reading at a lower Lexile level while still providing a greater depth of knowledge.
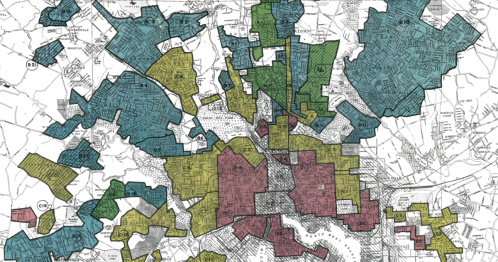
This Learning Resource uses maps from the research project Mapping Inequality: Redlining in New Deal America. The maps capture the color-coded system created in the 1930s by the Home Owners’ Loan Corporation to determine which city neighborhoods were good credit risks for home loans. The HOLC data helped set the rules for 100 years of real estate practice and helps explain the social and economic inequality that has existed in U.S. cities since the Great Depression. As a companion to “Mapping Inequality,” this resource also uses “Renewing Inequality: Urban Renewal, Family Displacements, and Race 1950-1966,” a digital map that includes maps and data that tell the story of urban renewal in the 1950s and 1960s in America. Prior to teaching this lesson on urban renewal, you may wish to use the learning resource for Mapping Inequality with your students. They will need to be familiar with the concept of redlining as well as with the Home Owners’ Loan Corporation (HOLC).
This learning resource uses instructional strategies and resources from Facing History (3-2-1 graphic organizer), Project Zero (I Used To Think… Now I Think….), and Bunk (an annotated collection, “Redlining Is Only Part of the Story”).
These Learning Resources follow a variation of the 5Es instructional model, and each section may be taught as a separate learning experience, or as part of a sequence of learning experiences. We provide each of our Learning Resources in multiple formats, including web-based and as an editable Google Doc for educators to teach and adapt selected learning experiences as they best suit the needs of your students and local curriculum. You may also wish to embed or remix them into a playlist for students working remotely or independently.
For Students:
Much has been written in recent years about the New Deal era policies and federal programs that have come to be labeled "redlining." This learning resource explores the bigger picture, making connections between these policies and programs, and the connections in later decades to themes of poverty, race, and social class through policies and programs known as Urban Renewal in post-World War II America.
Engage:
What is the history of a place?
When we are traveling in our hometowns, how often do we think about what was in a particular neighborhood, parking lot, or public space before it looked the way it does today?
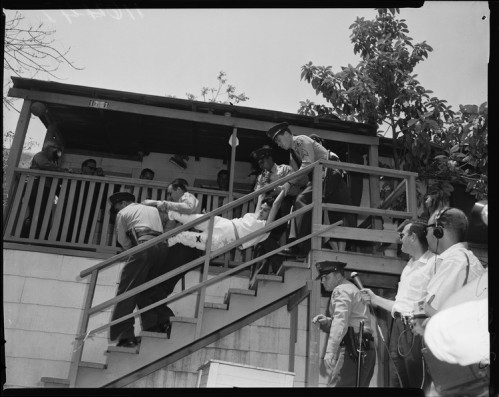
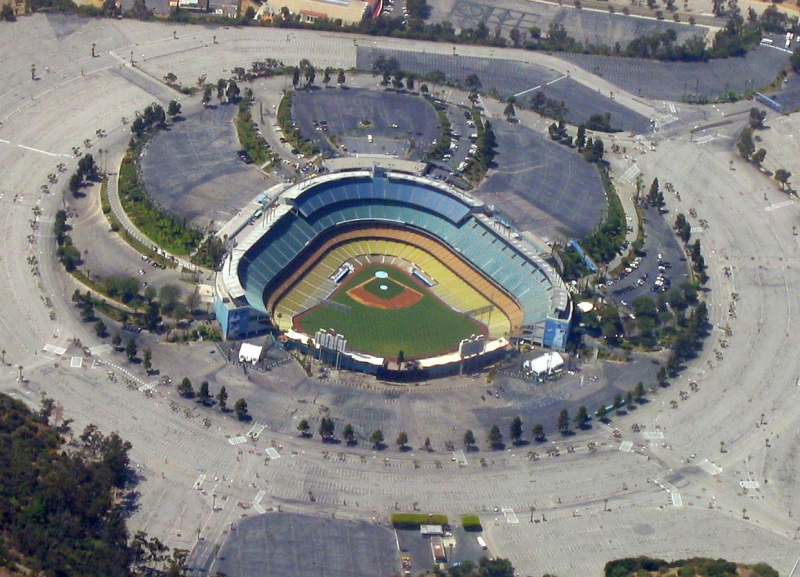
Consider Dodger Stadium in Los Angeles, California. Analyze the image below. What do you notice about this photograph?
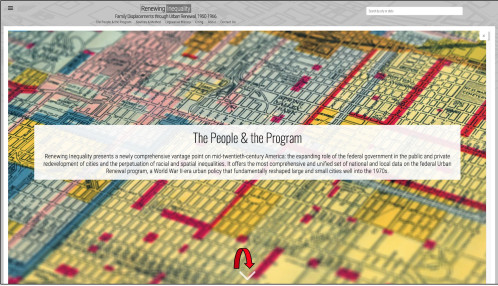
Next, examine the below image from the landing page of Renewing Equality.
- What do you notice?
- How might these images be related?
- Where might you find the answers to these questions?
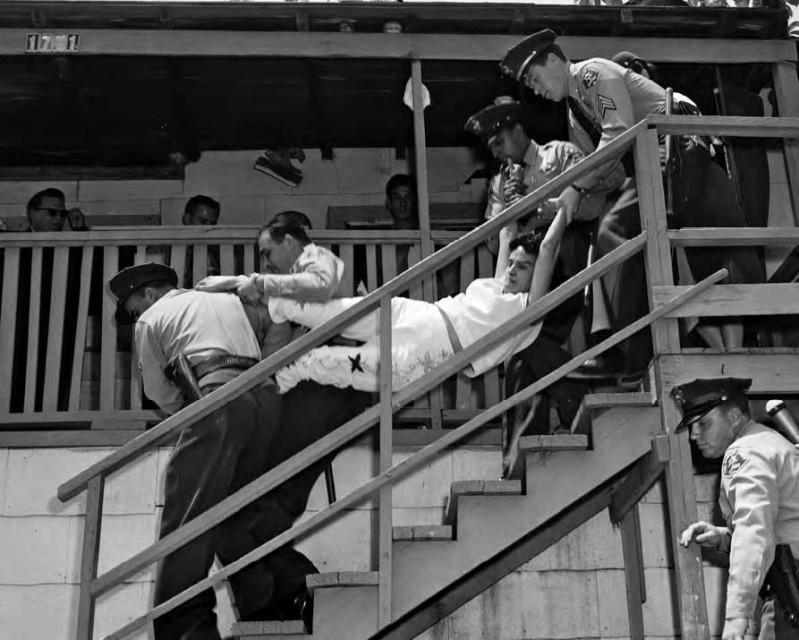
View the "People and the Program" StoryMap from Renewing Inequality. Scroll down through the StoryMap until you find the same image above, and can view it within the context of historical events. Scroll down through the StoryMap to view the next related image, and read about their connection to Dodgers Stadium.
How does the photo shift your thinking about the photo of Dodger Stadium? What questions do you have now that you have seen both images?
Now think of a stadium or public venue near you where sporting events, festivals, or concerts are held.
- Is it located downtown?
- On the outskirts of a city?
- Near a highway?
- A river?
- Public transportation hub?
- Do you know what was there before it was a stadium, arena, or public space?
- More importantly, do you know who was there?
If it was difficult to answer those last two questions, why do you think that is the case?
Your teacher may ask you to record your answers on an exit ticket.
Explore:
How can visualizing data help us learn about complex histories, including urban renewal?
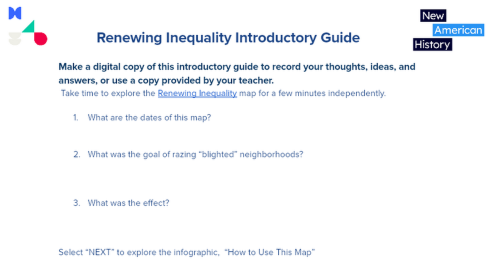
As directed by your teacher (on your own or with a partner, in class, or at home), complete the “Renewing Inequality Introductory Guide.” To begin, navigate to the Renewing Inequality homepage, read the introductory text, and answer questions 1-3. When you are ready to proceed, select “NEXT.”
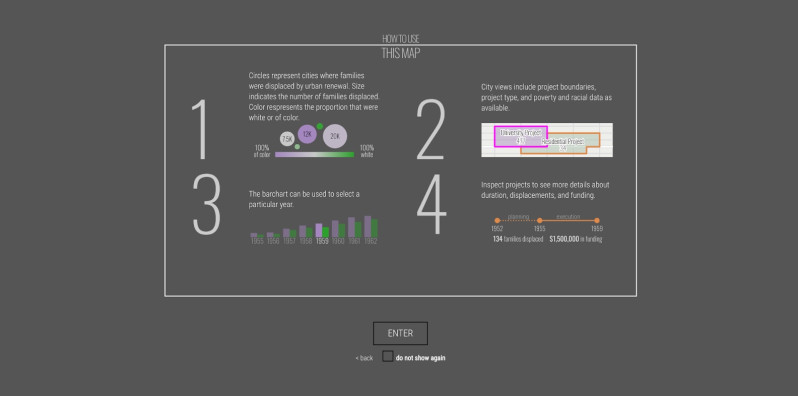
When you get to the next page, you will see an infographic, “How to Use This Map.” Spend some time on this page to answer questions 4-7 and become familiar with the digital tools you will use to interpret the maps. When you are finished, select “ENTER”.
If time permits, your teacher may allow you to compare your responses with a partner, or if working remotely, share as a collaborative document or use video conferencing.
Your teacher may ask you to record your answers on the graphic organizer as an exit ticket.
Explain:
What did urban renewal look like in cities across the country?
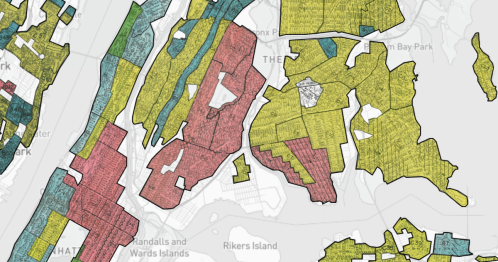
Working with a partner, as directed by your teacher, explore the Renewing Inequality map. Locate the city of Boston using the search box in the top right corner of the map or navigate using the circle representing Boston on the map, then look at the detailed map and legend.
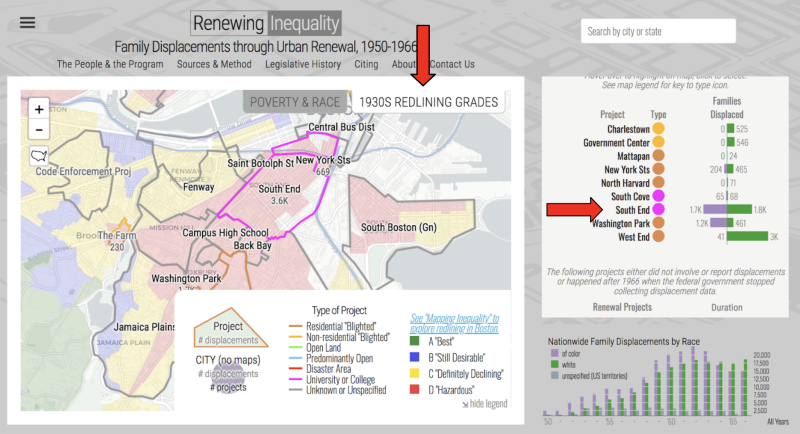
Notice the list of projects. Each is color coded and details the number of families who were displaced. For example, the South End project was identified as a “University or College” project and displaced approximately 1.7 thousand families of color (purple) and 1.8 thousand white families (green).
In the top right corner of the map, you will see a tab labeled “1930s redlining grades.” If you click on that, you will see how a federal agency, the Home Owners Loan Corporation (HOLC), graded the neighborhoods. The South End is largely shaded in red, meaning that it was determined by the HOLC to be “hazardous.” (For more information about the HOLC maps, visit Mapping Inequality.)
- How do you think redlining grades from the 1930s might have affected urban renewal project decisions in later years?
- What do you think happened to the more than 3,000 families who were displaced from the South End for the renewal project?
- Why might we not know what happened to those who were displaced?
With a partner, choose another location on the map to explore in more depth. Complete the 3-2-1 graphic organizer to help you organize your thinking.
The results you explored for the city of Boston are an interesting case study, as the majority of the families displaced were white. This illustrates how the urban renewal story is not always determined by race, and we must look at the data across a wider lens to notice patterns.
- How does this example from Boston compare to the other cities you explored on the Renewing Inequality map?
- What might be your next steps to look for more patterns in the data?
Share your observations with a partner or in small groups, as directed by your teacher. If working virtually your teacher may allow you to share using collaborative documents such as Google Docs or Google Slides, or via video conferencing.
Your teacher may ask you to record your answers on the graphic organizer as an exit ticket.
Elaborate:
How do we decide how public land is designated and who it should benefit?
Visit this annotated collection of resources from the Bunk Originals archive that helps explain the long history of housing discrimination. As you read the narrative by Dr. Julian Maxwell Hayter, look for the connection between redlining and urban renewal programs.
Navigate to and read at least one or two of the articles Dr. Hayter includes in the narrative. Explore other content related to these topics as connected in Bunk.
When you finish reading, complete this I used to think… Now I think… graphic organizer.
Finally, your teacher will lead a whole class discussion using the following question:
“How do we decide what land is for and who it should benefit?”
Your teacher may ask you to record your answers on an exit ticket.
Extend:
How can you influence the civic choices made for your town or city?
Locate and take some time to further explore the StoryMap entitled “The People and the Program,” located in the menu bar of the Renewing Inequality map.
“Rather than see the ongoing inequalities and spatial fragmentation of cities and suburbs today as the inevitable outcome of market forces, then, Renewing Inequality reminds us that the cities and suburbs we live in are the result of conscious choices. It falls to us, then, to decide what kinds of cities we choose to live in in the future. Rather than see the ongoing inequalities and spatial fragmentation of cities and suburbs today as the inevitable outcome of market forces, then, Renewing Inequality reminds us that the cities and suburbs we live in are the result of conscious choices. It falls to us, then, to decide what kinds of cities we choose to live in in the future.”
Spend some time unpacking this quote. Consider using the Key Vocabulary section of this learning resource, or a tool such as Rewordify to help you better understand this complex text.
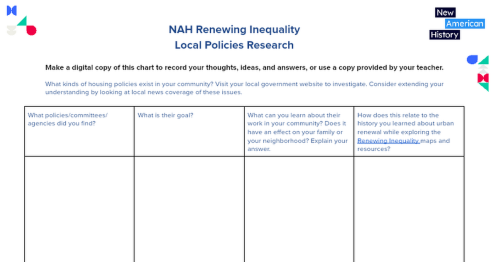
What kinds of housing policies exist in your community? Visit your local government’s website to learn more about its programs, and complete the Local Policies Research graphic organizer.
Share your research with a partner or as part of a whole class discussion, as directed by your teacher. Who else might be interested in learning more about your research?
Let us know what you find! Share your ideas with us if your teacher or a trusted adult permits. You may email us at editor@newamericanhistory.org or share via social media (links on our pages). Be sure to tag us as you share!
Your teacher may ask you to record your answers on an exit ticket.
Citations:
Digital Scholarship Lab, “Mapping Inequality,” American Panorama, ed. Robert K. Nelson and Edward L. Ayers, accessed July 20, 2022, https://dsl.richmond.edu/panorama/redlining
Digital Scholarship Lab, “Renewing Inequality,” American Panorama, ed. Robert K. Nelson and Edward L. Ayers, accessed July 21, 2022, https://dsl.richmond.edu/panorama/renewal/#view=0/0/1&viz=cartogram.
Hayter, Julian Maxwell. “Redlining Is Only Part of the Story.” Bunk. New American History, October 5, 2022. https://www.bunkhistory.org/resources/10722.
View this Learning Resource as a Google Doc