
This work by New American History is licensed under a Attribution-NonCommercial-ShareAlike 4.0 (CC BY-NC-SA 4.0) International License. Permissions beyond the scope of this license may be available at newamericanhistory.org.
Renewing Inequality
From Redlining to Family Displacements through Urban Renewal, 1950-1966
View Student Version
Standards
Common Core:CCSS.ELA-LITERACY.RH.11-12.7Integrate and evaluate multiple sources of information presented in diverse formats and media (e.g., visually, quantitatively, as well as in words) in order to address a question or solve a problem.
C3 Framework:D2.His.3.6-8. Use questions generated about individuals and groups to analyze why they developed, and the developments they shaped, are seen as historically significant.D2.His.3.9-12. Use questions generated about individuals and groups to assess how the significance of their actions changes over time and is shaped by the historical context.
National Council for Social Studies:Theme 2 - TIME, CONTINUITY, AND CHANGETheme 5 - INDIVIDUALS, GROUPS, AND INSTITUTIONS
National Geography Standards: Standard 1 - How to use maps and other geographic representations, geospatial technologies, and spatial thinking to understand and communicate informationStandard 12 - The processes, patterns, and functions of human settlement
College Board AP U.S. History (Fall 2020):HISTORICAL THINKING SKILLS COVERED:SKILL 4.A – Identify and describe a historical context for a specific historical process or development.SKILL 5.A: Identify patterns or connections between historical developments.HISTORICAL DEVELOPMENTS COVERED:TOPIC 8.9 - The Great Society:KC-8.2.III.B.i - Liberal ideas found expression in Lyndon Johnson’s Great Society, which attempted to use federal legislation and programs to end racial discrimination, eliminate poverty, and address other social issues.TOPIC 8.15 - Continuity & Change in Period 8:KC-8.2.I - Seeking to fulfill Reconstruction-era promises, civil rights activists and political leaders achieved some legal and political successes in ending segregation, although progress toward racial equality was slow.
Advanced Placement Human Geography (Fall 2020): ENDURING UNDERSTANDING SPS-6 Urban areas face unique economic, political, cultural, and environmental challenges.ESSENTIAL KNOWLEDGE SPS-6.A.1 As urban populations move within a city, economic and social challenges resultSPS-6.A.4 Urban renewal and gentrification have both positive and negative consequences. SPS-6.A.5 Functional and geographic fragmentation of governments—the way government agencies and institutions are dispersed between state, county, city, and neighborhood levels—presents challenges in addressing urban issues.
EAD Roadmap: Theme: Institutional and Social Transformation Design Challenge: Motivating Agency, Sustaining the Republic
Teacher Tip: Think about what students should be able to KNOW, UNDERSTAND and DO at the conclusion of this learning experience. A brief exit pass or other formative assessment may be used to assess student understandings. Setting specific learning targets for the appropriate grade level and content area will increase student success.
Suggested Grade Levels:High School (9-12), Advanced Placement U.S. History or Advanced Placement Human Geography coursesSuggested Timeframe:Two or three 90-minute class periods
Suggested Materials:Internet access via laptop, tablet or mobile device, projection screen
Key Vocabulary
Blighted - any area that endangers the public health, safety or welfare; or any area that is detrimental to the public health, safety, or welfare because commercial, industrial, or residential structures or improvements are dilapidated, or deteriorated or because such structures or improvements violate minimum health and safety standards.
Displacement - the forced departure of people from their homes or land
Eminent domain - the legal right of a government to take private property from its owner for public use
Home Owners’ Loan Corporation (HOLC) - an agency created in 1933 under FDR’s New Deal that attempted to prevent foreclosures by refinancing home mortgages in default
Inequality - when some people have more opportunities, money, or advantages than other people
The New Deal - President Franklin D. Roosevelt’s program to help solve the economic problems triggered by the Great Depression
Redlining - the practice of withholding mortgage financing to residents of neighborhoods that the Home Owners’ Loan Corporation deemed “hazardous”
Rural - areas which are not towns or cities or suburbs, often farming or agricultural areas
StoryMap - a web-based map integrating text, images, and multimedia elements to help users explore content and visualize data.
Suburbs - an area outside of a city that is primarily residential
Urban - related to a city or large town, usually more densely populated
Urban Renewal - the process of seizing and demolishing large tracts of private and public property for the purpose of modernizing and improving aging infrastructure
White flight - the large migration of white people from cities to the suburbs, largely in the years spanning the 1950s to the 1980s
Read for Understanding
Teacher Tips:
This Learning Resource includes language in the body of the text to help adapt to a variety of educational settings, including remote learning environments, face-to-face instruction, and blended learning.
If you are teaching remotely, consider using videoconferencing to provide opportunities for students to work in partners or small groups. Digital tools such as Google Docs or Google Slides may also be used for collaboration. Rewordify and WordTuneRead help make a complex text more accessible for those reading at a lower Lexile level while still providing a greater depth of knowledge.
This Learning Resource uses maps from the research project Mapping Inequality: Redlining in New Deal America. The maps capture the color-coded system created in the 1930s by the Home Owners’ Loan Corporation to determine which city neighborhoods were good credit risks for home loans. The HOLC data helped set the rules for 100 years of real estate practice and helps explain the social and economic inequality that has existed in U.S. cities since the Great Depression. As a companion to “Mapping Inequality,” this resource also uses “Renewing Inequality: Urban Renewal, Family Displacements, and Race 1950-1966”, a digital narrative that includes maps and data that tell the story of urban renewal in the 1950s and 1960s in America. This video provides additional context for the time period and map, and may also be shared with students, or for building educators' and community members' background knowledge.
This Resource also uses Bunk Connections, a feature that connects two articles on the Bunk platform through their shared ideas, places, or time periods, as well as Bunk Exhibits, a series of thematic readings from the Bunk archive.
This Learning Resource uses a Turn and Talk strategy to allow students to work with an “elbow partner” for brief collaborations. It also uses a Debrief strategy, in which the teacher will identify exemplary student responses and share those with the whole class, commenting further on what makes them effective. In addition, this Learning Resource uses one or more “Thinking Routines” from Project Zero, a research center at the Harvard Graduate School of Education that has developed learning strategies that encourage students to add complexity to their thought processes. For an overview of Project Zero’s methodology, you may want to read its Exploring Complexity Bundle. Specifically for this lesson, students will use the See-Think-Wonder, 3-2-1, and Read and S-I-T Thinking Routines. A Data Organizer template is also provided for students to organize their thinking and a Proposal Form template for a final Take Action learning experience.
Lastly, this Learning Resource follows a variation of the 5Es instructional model, and each section may be taught as a separate learning experience, or as part of a sequence of learning experiences. We provide each of our Learning Resources in multiple formats, including web-based and an editable Google Doc for educators to teach and adapt selected learning experiences as they best suit the needs of your students and local curriculum. You may also wish to embed or remix them into a playlist for students working remotely or independently.
Engage:
Intent vs. impact: What did government policy intend to do, and what actually happened?
In the 1950s and 1960s, the U.S. government gave money to cities to tear down and redevelop what it called “blighted” or “slum” neighborhoods. “Urban renewal” became the term used to describe this program. Its intent was to revitalize cities economically and counteract white flight. The program displaced tens of thousands of families from their homes each year, with families of color disproportionately pushed out. Families were promised payment for their homes or guarantees that they would be relocated to public housing, but these promises were often too late or insufficient to cover the costs of moving.
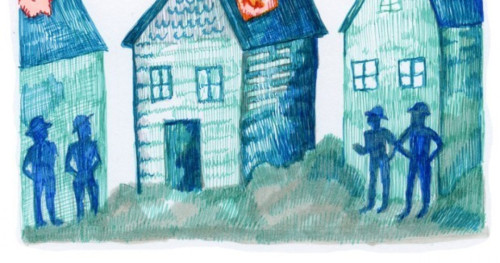
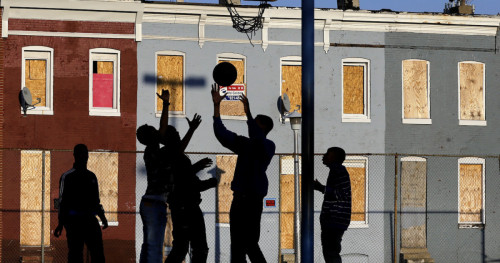
The photo below shows a moment in the story of urban renewal.
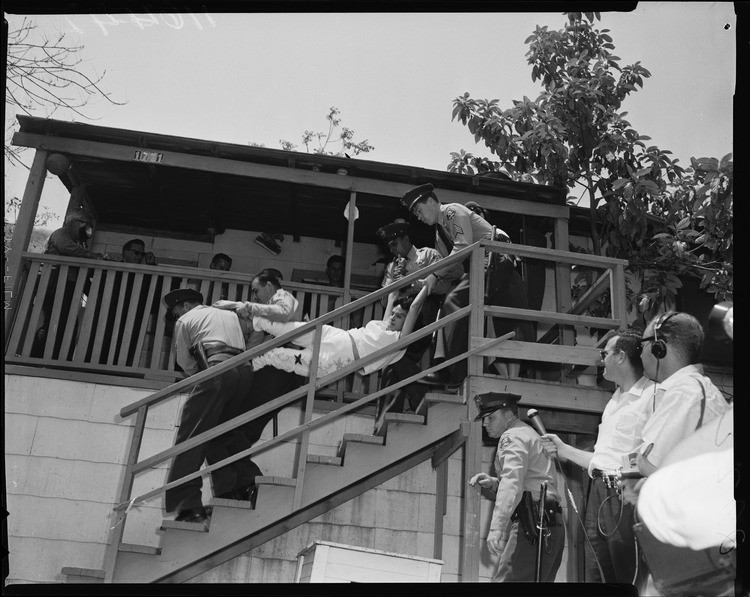
CONTEXT: Aurora Vargas resisted displacement. She was physically removed from her home prior to its demolition in Chavez Ravine, Los Angeles, California. Vargas' home was seized as part of the Temple Area renewal project, which displaced more than 1,600 families to make way for the Los Angeles Dodgers baseball stadium.
VISUAL DISCOVERY: Analyze this image by adding at least two ideas to each column of your “See, Think, Wonder” graphic organizer. Share your ideas in small groups or with the whole class. If working remotely, you may use breakout rooms through videoconferencing or share via a collaborative document such as Google Docs or Google Slides.
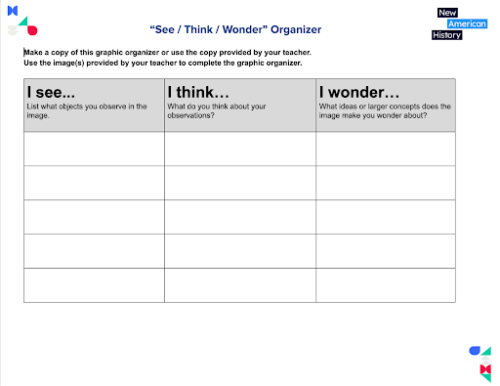
NAH "See / Think / Wonder" GraphicOrganizer
Use the image provided by your teacher to complete the See Think Wonder Graphic Organizer. I see... List what objects you observe in the image. I think… What do you think about your observations? I wonder… What ideas or larger concepts does the image make you wonder abo...
docs.google.com
INTENT & IMPACT: Compare the stated intent of the government’s policy with its real-world impact.
Read this illustrated article in Bunk about urban renewal in Roanoke, Virginia.
Even the Dead Could Not Stay
An illustrated history of urban renewal in Roanoke, Virginia.
www.bunkhistory.org
Specifically, focus on the statement made by 33rd U.S. President Harry S. Truman. Explore some of the Bunk connections made to the article. Turn and talk to an ‘elbow partner,” and share one interesting connection you made.

Then, watch this short clip from an interview with James Baldwin, an American writer, and activist (1924 - 1987).
Next, turn to a partner and answer these questions together:
- What did Truman hope that urban renewal would accomplish?
- According to Baldwin, what was the impact of urban renewal?
- What do you think accounts for the differences in viewpoint?
If working remotely, you may use breakout rooms through videoconferencing or share via a collaborative document such as Google Docs or Google Slides.
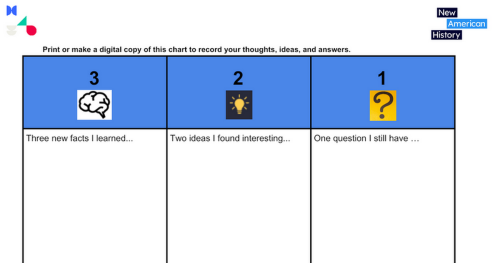
Then, use your ideas from the answers to explore Bunk and find excerpts that relate to urban renewal. Record your research findings in this 3-2-1 Chart. Copy and submit when finished, including a link to the Bunk excerpts you used.
NAH 321 Chart
Print or make a digital copy of this chart to record your thoughts, ideas, and answers. 3 2 1 Three new facts I learned... Two ideas I found interesting... One question I still have …
docs.google.com
Your teacher may ask you to record your answers on an exit ticket.
Explore:
What did urban renewal look like within American cities?
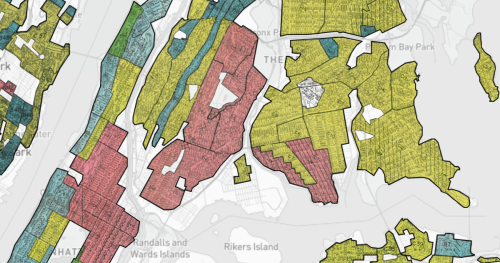
THE BACKSTORY OF URBAN RENEWAL – Urban renewal sought to improve the housing stock in cities. The thinking behind urban renewal had its roots in the 1930s. In the depths of the Great Depression, the federal government devised a way to help homeowners. In 1933, it helped create an agency called the Home Owners’ Loan Corporation (HOLC) to prevent foreclosures and to help distressed homeowners refinance their mortgages. As part of its work, HOLC assigned grades to residential neighborhoods to signal to banks and mortgage lenders who to give loans to and which areas of a city were safe investments. If a neighborhood was graded “D” and colored red on the HOLC map, it was considered “hazardous”. As a result, residents there would be less likely to receive loans. This HOLC practice of color-coding city neighborhoods to determine their financial risk level has been termed redlining, and it made it challenging for certain residents – especially Black citizens and immigrants – to become homeowners. Redlining is one government policy that has contributed to America’s social and economic inequalities.
Explore Mapping Inequality, a map digitizing data collected by the HOLC collected from 1935 to 1940. It illustrates what redlining looked like in more than 200 cities, and includes primary source documents used to collect the data, as well as other essays to contextualize the data.
Mapping Inequality
Redlining in New Deal America
dsl.richmond.edu
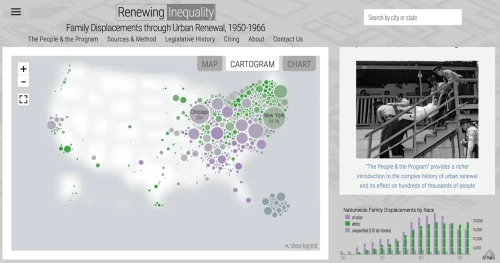
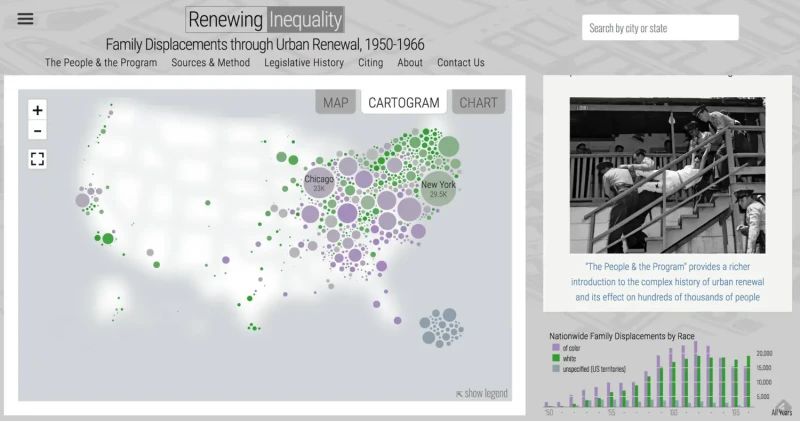
Next, explore the connection between redlining and urban renewal. First, go to the “Renewing Inequality” map.
Renewing Inequality
Urban Renewal, Family Displacements, and Race 1950-1966
dsl.richmond.edu
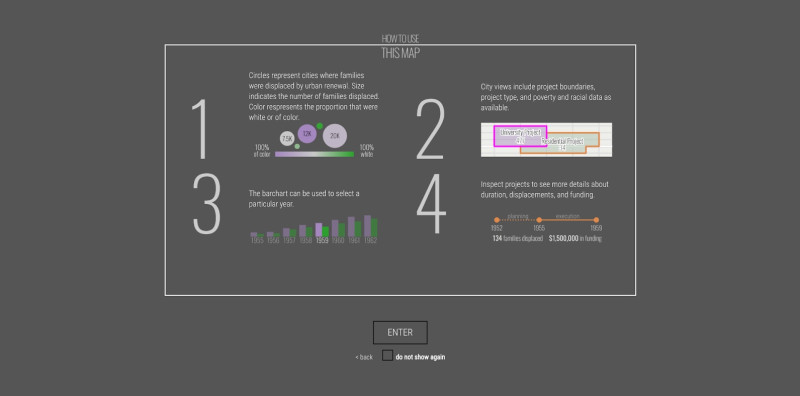
Click NEXT on the home page, then analyze the infographic sharing the four steps for “How To Use This Map.” When you finish, click “ENTER.”
Next, search two cities using the search bar in the upper right corner: Richmond, Virginia, and Chicago, Illinois. Once each city’s profile and map load, click the tab labeled “1930s Redlining Grades.” (Note: Not all cities included in Renewing Inequality were part of the original HOLC maps, and not all cities mapped by the HOLC were included in the urban renewal programs on the map.) Toggle between the MAP view and the CARTOGRAM view to see all results.
Try searching for a city closer to your current location. (If you are in Richmond or Chicago, select another city of your choice!)
Then, answer these questions:
- Was the city you selected included in the original HOLC maps you explored in Mapping Inequality?
- Where were there few or no cities mapped during the New Deal era?
- Compare these locations to those that were included on the map of urban renewal. What do you notice about the relationship between the urban renewal areas of the city and the areas in red that received a “D” grade?
Through the federal government’s urban renewal program, cities displaced hundreds of thousands of families from their homes and neighborhoods. "Renewing Inequality” helps to visualize these displacements by zooming in on cities and their specific neighborhoods.

Renewing Inequality
Urban Renewal, Family Displacements, and Race 1950-1966
dsl.richmond.edu
In groups of three or four, access the “Renewing Inequality” map. Take a few minutes to explore the map, including the ways data is visualized. Refer back to the How to Use this Map Infographic from the as needed.
Examine urban renewal from 1950 to 1966 in America by making a copy and completing this Data Organizer.
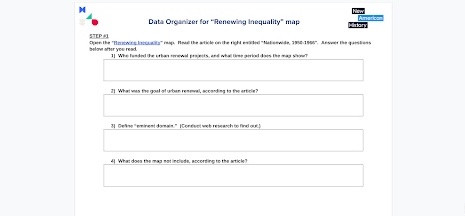
NAH Data Organizer for "Renewing Inequality" map
STEP #1 Open the “Renewing Inequality” map. Read the article on the right of the home page entitled “Nationwide, 1950-1966”. Answer the questions below after you read. Who funded the urban renewal projects, and what time period does the map show? What was the goal of urban renewal, acco...
docs.google.com
Your teacher may ask you to record your answers on an exit ticket.
Explain:
How did the federal government perpetuate social inequalities in American cities?
Go to the homepage of the “Renewing Inequality” map. Select the link along the top left side of the menu, entitled “The People & the Program.”
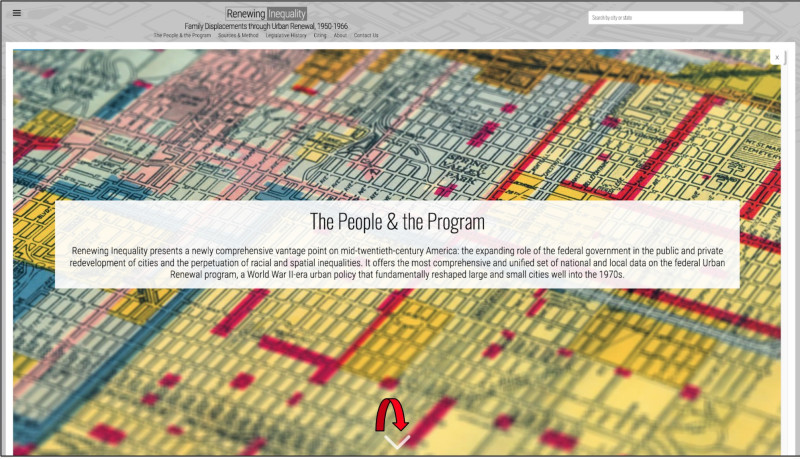
Scroll down through this StoryMap embedded in Renewing Inequality, and read all of the accompanying text.
Revisit this question, based on your previous explorations of the Renewing Inequality map and additional information you learned from the People and the Program section of the Storymap.
- What do you notice about the relationship between the urban renewal areas of the cities on the Renewing Inequality map, and the areas in red that received a “D” grade on the HOLC maps from Mapping Inequality?
- Why do you think this relationship exists?
After you read, review the People and the Program StoryMap and complete this “Read and S-I-T” graphic organizer.
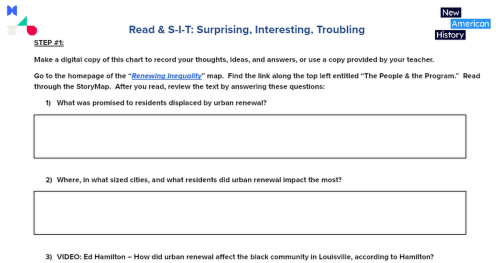
NAH Read & S-I-T for Urban Renewal learning resources
STEP #1: Make a digital copy of this chart to record your thoughts, ideas, and answers, or use a copy provided by your teacher. Go to the homepage of the “Renewing Inequality” map. Find the link along the top left entitled “The People & the Program.” Read through the StoryMap. After you re...
docs.google.com
After you complete the graphic organizer, share your ideas within small groups or with the whole class as directed by your teacher.
If working remotely, you may use breakout rooms through videoconferencing or share via a collaborative document such as Google Docs or Google Slides.
Your teacher may ask you to record your answers on an exit ticket.
Elaborate:
What were the costs and critiques of urban renewal?
Urban renewal programs invited municipalities and real-estate firms to redevelop land they deemed “blighted.” Aside from displacing residents, the programs built highways through neighborhoods to entice suburbanites to the cities they had left. The programs disconnected social life and tore at the fabric of existing communities. However, some critiqued the assumptions that fueled urban renewal and pushed back against city planners.
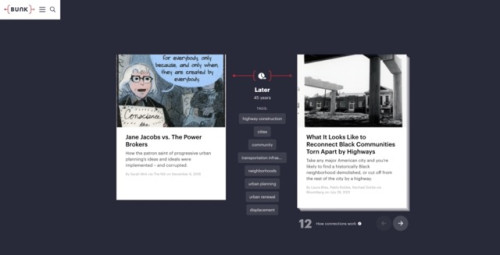
Explore this Bunk Connection by reading excerpts from “Jane Jacobs vs. The Power Brokers” and “What It Looks Like to Reconnect Black Communities Torn Apart by Highways.”
Before you read, review the questions in the “Take Note” Thinking Routine. After you read, you will choose one of the following questions to answer. Don’t try to take notes as you read; focus instead on becoming fully engaged in the reading.
- What is the most important point?
- What are you finding challenging, puzzling, or difficult to understand?
- What question would you most like to discuss?
- What is something you found interesting?
When you finish reading, answer one of the Take Note questions above. Your teacher may provide access to a Google Docs discussion board, or allow you to collaborate on a Google Slides set. Your teacher will debrief by reviewing the main ideas of each piece and by reading back student responses to the class and asking follow-up questions or by asking you to turn and talk to a partner to share your answers.
Lastly, you will end with a discussion of this Exit Question, using ideas from the readings:
What were the costs and critiques of urban renewal?
Your teacher may ask you to record your answers on an exit ticket.
Extend:
How can local, state, and federal governments right the wrongs of urban renewal?
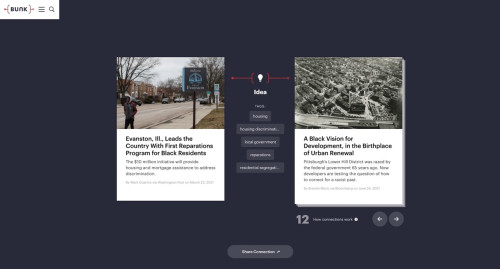
Scholars and policy experts have shared many suggestions and solutions for how to address the inequalities and injustices perpetuated by family displacement during this period of urban renewal. Explore this Bunk Connection by reading excerpts from “Evanston, Ill., Leads the Country With First Reparations Program for Black Residents” and “A Black Vision for Development, in the Birthplace of Urban Renewal.”
Turn and talk to an elbow partner, each taking turns to summarize one of the two excerpts. Next, read each article in its entirety, using the links at the bottom of each excerpt. After you do, answer these questions:
- Summarize the proposed solutions in the articles.
- How effective do you think each of these solutions is?
- What questions do you still have about the articles?
Housing Injustice
More than a half-century after the passage of the Fair Housing Act, American cities are still profoundly segregated. Who and what is to blame? This exhibit explores the complex legacies of redlining, urban renewal, and financial deregulation to explain the persistence – and costs – of residential segregation today.
www.bunkhistory.org
Then, conduct research to propose your own solution. To organize your proposal, research excerpts from this Bunk Exhibit on “Housing Injustice” and complete this Proposal Form.
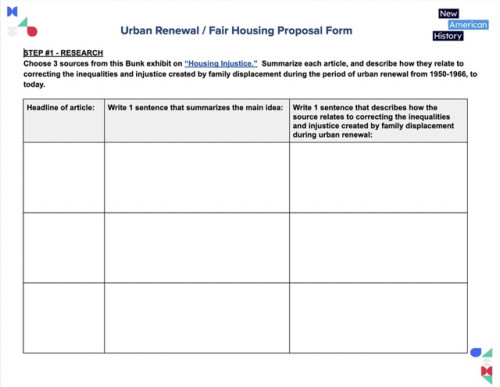
NAH Urban Renewal Proposal Form
STEP #1 - RESEARCH Choose 3 sources from this Bunk exhibit on “Housing Injustice.” Summarize each article, and describe how they relate to correcting the inequalities and injustice created by family displacement during the period of urban renewal from 1950-1966, to today. Headline of artic...
docs.google.com
Your teacher may ask you to record your answers on an exit ticket.
Citations:
Bloomberg.com. Bloomberg. Accessed July 1, 2022. https://www.bloomberg.com/news/articles/2018-01-19/an-illustrated-history-of-urban-renewal-in-roanoke.
Digital Scholarship Lab, “Renewing Inequality,” American Panorama, ed. Robert K. Nelson and Edward L. Ayers, accessed July 1, 2022, https://dsl.richmond.edu/panorama/renewal/#view=0/0/1&viz=cartogram.
Dottle, Rachael, Laura Bliss, and Pablo Robles. “What It Looks Like to Reconnect Black Communities Torn Apart by Highways.” Bloomberg.com. Bloomberg. Accessed July 1, 2022. https://www.bloomberg.com/graphics/2021-urban-highways-infrastructure-racism/.
Graham, Vince. “Urban Renewal...Means Negro Removal. ~ James Baldwin (1963)”. YouTube video, 1:14. June 30, 2022. https://youtu.be/T8Abhj17kYU.
Guarino, Mark. “Evanston, Ill., Leads the Country with First Reparations Program for Black Residents.” The Washington Post. WP Company, March 23, 2021. https://www.washingtonpost.com/national/evanston-illinois-reparations/2021/03/22/6b5a308c-8b2d-11eb-9423-04079921c915_story.html.
“Housing Injustice.” Bunk History. Accessed July 1, 2022. https://www.bunkhistory.org/exhibits/37.
Mock, Brentin. “A Black Vision for Development, in the Birthplace of Urban Renewal.” Bloomberg.com. Bloomberg, June 24, 2021. https://www.bloomberg.com/news/features/2021-06-24/can-a-demolished-black-neighborhood-build-back-better.
Raised/Razed. VPM.org. (2022, May 9). Retrieved June 30, 2022, from https://vpm.org/raisedrazed#section-9698151
Roche, Jackie, and Sarah Mirk. “Jane Jacobs vs. the Power Brokers.” The Nib, January 1, 2022. https://thenib.com/jane-jacobs-vs-the-power-brokers/.
View this Learning Resource as a Google Doc